Base IMIS User Manual
- Base IMIS
- Introduction
- 1.1 Overview
- 1.2 Modules
- 1.2.1 Building Information Management System (BIMS)
- 1.2.2 Utility Information Management System (UIMS)
- 1.2.3 Faecal Sludge Information Management System (FSIMS)
- 1.2.4 Community Toilet / Public Toilet Information Management System (PTCTIMS)
- 1.2.5 Sewer Connection Information Management System (SCISS)
- 1.2.6 Public Health Information Support System (PHISS)
- 1.2.7 Property Tax Collection Information Support System (PTCISS)
- 1.2.8 Solid Waste Information Support System (SWISS)
- 1.2.9 Water Supply Information Support System (WSISS)
- 1.2.10 Urban Management Decision Support System (UMDSS)
- 1.2.11 Settings
- Accessing the IMIS
- Dashboard
- Sidebar
- Filters
- Actions
- List of Actions
- 6.1 Edit Record
- 6.2 View History
- 6.3 Delete Record
- 6.4 View on Map
- 6.5 Show Details of Record
- 6.6 View Nearest Road of Record
- 6.7 View Login Activity
- 6.8 Chart Card Tools
- System Notifications
- Tools
- Building Information Management System (BIMS)
- About BIMS
- 9.1 Building Information Dashboard
- 9.2 Buildings
- 9.2.3 Add Containment to Building
- 9.2.4 View containments connected to the Building
- 9.3 Building Survey
- 9.3.2 Approve Building Structure
- 9.3.4 Download Building KML File
- 9.4 Low Income Community
- Fecal Sludge Information Management System (FSIMS)
- Introduction to FSIMS
- 10.1 FSM Dashboard
- 10.2 Containment IMS
- 10.3.1 Service Providers
- 10.4 Treatment Plant IMS
- 10.5 Performance Efficiency Standards
- 10.6 Emptying Service IMS
- Sewer Connection Information Support System (SCIMS)
- PT/CT IMS
- CWIS Information Management System (CWIS IMS)
- CWIS IMIS Introduction
- 13.1 CWIS Dashboard
- 13.2 CWIS Generator
- 13.3 CWIS Settings
- 13.4 KPI Dashboard
- 13.5 KPI Target
- Utility IMS
- Solid Waste Information Support System (SWISS)
- Property Tax Collection Information Support System (PTCISS)
- Water Supply Information Support System (WSISS)
- Urban Management DSS
- Urban Management DSS Introduction
- 18.1 Export Data
- 18.2 Map Feature
- 18.3.1 General Tools
- 18.3.2 Layers TAB
- 18.3.3 Tools TAB
- Public Health ISS
- Introduction to Public Health ISS
- 19.1 Water Samples
- 19.2 Waterborne Hotspot
- 19.3 Waterborne Cases Information
- Settings
Base IMIS
|
Base IMIS User Manual |
|
© 2022-2025 by ISPL & GWSC-AIT is licensed under CC BY-NC-SA 4.0 Version 1.0.0 |
Introduction
The purpose of this user manual is to guide the users of IMIS on the functionalities of the web interface of IMIS. It provides detailed step-by-step procedures of all functionalities found within the IMIS web application as well as the working principle of IMIS.
1.1 Overview
The purpose of this user manual is to guide the users of IMIS on the functionalities of the web interface of IMIS. It provides detailed step-by-step procedures of all functionalities found within the IMIS web application as well as the working principle of IMIS.
The Integrated Municipal Information System (IMIS) is a comprehensive digital platform designed to transform how municipalities manage sanitation systems and services, aligning with the principles of Citywide Inclusive Sanitation (CWIS) to achieve Sustainable Development Goal (SDG) 6.2. IMIS equips municipal authorities with tools to plan, monitor, and optimize sanitation service delivery, ensuring equitable access for all, particularly underserved communities. By integrating geospatial data, real-time service tracking, and sanitation-specific analytics, IMIS supports evidence-based decision-making and enhances resource allocation to improve sanitation outcomes.
IMIS also functions as a Digital Public Infrastructure (DPI) at the sub-national level, facilitating the generation and organization of critical data for urban sanitation management. Beyond supporting local governance, IMIS serves as a foundational data system that feeds data into national-level systems for monitoring CWIS indicators and other metrics critical for achieving sanitation targets. This capability ensures alignment between municipal operations and broader national objectives, creating a seamless flow of actionable data across governance levels.
IMIS supports the Planning, Management, and Monitoring & Evaluation (M&E) framework for CWIS systems and services (see Figure 1-1). This framework emphasizes a structured approach to achieving inclusive and sustainable sanitation outcomes. The Planning component focuses on equitable and gender-inclusive strategies, sustainable financing, and transparent pricing mechanisms. The Management component ensures the safe, accountable, and financially sustainable operation of sanitation systems. The M&E component assesses service quality, equitable distribution, and the performance of sanitation authorities. Together, these components create a continuous feedback loop that helps municipalities refine their strategies and align them with national sanitation goals.
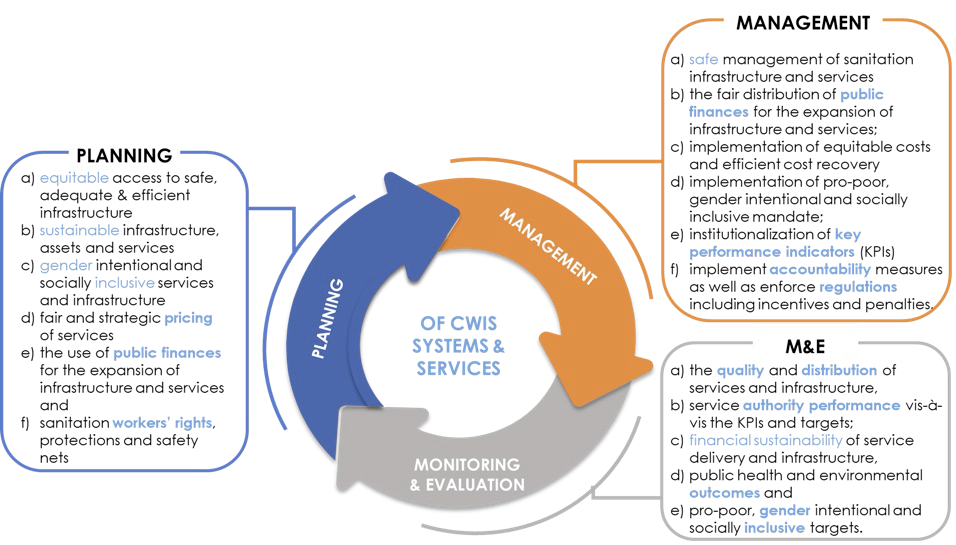
Figure 1- 1 Planning, Management and Monitoring & Evaluation Framework for implementing CWIS Approach
IMIS comprises ten functional modules, seven of which are core modules directly addressing sanitation systems and services, such as faecal sludge management, sewer connections, and public toilet operations. The remaining three value-added modules enhance complementary municipal services, including property tax collection, solid waste management, and water supply billing. Combined with the Urban Management Decision Support System (UMDSS)—a powerful tool for spatial analysis, mapping, and decision-making—IMIS empowers municipalities to adopt CWIS principles while contributing to broader urban governance. Each of these modules are discussed under sub chapter “Modules”.
Built on robust open-source technologies like PHP, PostgreSQL, and OpenLayers, IMIS is made freely available under the Creative Commons Attribution-NonCommercial-ShareAlike 4.0 International (CC BY-NC-SA 4.0) license. This licensing ensures that municipalities and stakeholders can access, use, and adapt the system to their needs while promoting collaboration and innovation in sanitation and urban governance. Its intuitive dashboards enable municipalities to track CWIS indicators, Key Performance Indicators (KPIs), and other metrics essential for sanitation management. As a sub-national data system and DPI, IMIS strengthens municipalities’ ability to achieve sanitation objectives locally while feeding reliable, standardized data into national systems for effective CWIS monitoring and governance.
1.2 Modules
The Integrated Municipal Information System (IMIS) consists of ten functional modules: seven core modules and three value-added modules (see Figure 1-2). The seven core modules include the Building Information Management System (BIMS), Utility Information Management System (UIMS), Faecal Sludge Information Management System (FSIMS), Community Toilet/ Public Toilet Information Management System (CTPIMS), Sewer Connection Information Management System (SCIMS), Public Health Information Support System (PHISS), and the Urban Management Decision Support System (UMDSS). The three value-added modules are the Property Tax Collection Information Support System (PTCISS), Solid Waste Information Support System (SWISS), and the Water Supply Information Support System (WSISS). These value-added modules primarily support property tax collection, solid waste management, and water supply billing units, utilizing IMIS as a digital infrastructure to enhance services and improve revenue collection processes. Unlike the core modules, these value-added modules rely on data imported from respective municipal units during their regular business processes, as IMIS does not create data for them. Additionally, they do not directly impact sanitation systems and services under the Citywide Inclusive Sanitation (CWIS) approach.
Conversely, all core modules, except for UMDSS, generate and utilize their own data for various analyses, significantly contributing to the management of sanitation systems and services within the CWIS framework. UMDSS, while not creating data itself, consolidates data from other modules to facilitate decision-making related to sanitation systems, services, and broader urban management issues through its various analytical tools. Access to these modules is determined by the functional roles of municipal staff, executives, and stakeholders, ensuring their integration into daily municipal operations for effective management.
The use of these modules must be embedded into the regular workflows of corresponding departments or units within the municipality. For instance, the FSTP operator, responsible for recording logs of faecal sludge disposed of at the FSTP, is required to use the “Sludge Collection” functional sub-module within FSIMS. Similarly, emptying operators must use the IMIS-provided mobile application to capture data during containment emptying processes under the relevant sub-modules. This integration ensures that information within IMIS is continuously updated without the need for additional resources dedicated solely to data entry.
Each of these ten functional modules is discussed in detail in subsequent sections of this chapter. Additionally, IMIS includes a dedicated Settings module, which focuses on system administration and is covered at the end of the chapter. This structured approach ensures that IMIS is seamlessly integrated into the municipality’s operational framework, supporting both sanitation and urban management.
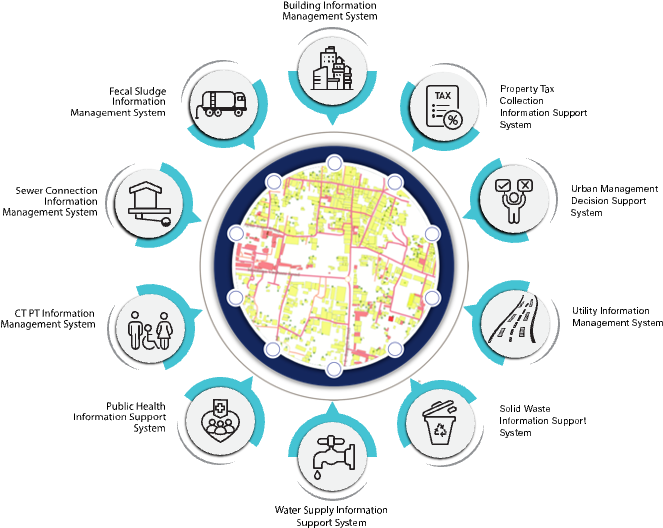
Figure 1-2 Functional Modules of IMIS
1.2.1 Building Information Management System (BIMS)
The BIMS is a core module of the IMIS that serves as a comprehensive database of all buildings within a municipality. It encompasses detailed information about each building, including: Physical attributes (structure type, number of floors, and year of construction); Location details (address and geographical coordinates with building footprints; Usage and ownership (Building usage, ownership status, and associated tax codes); Utilities and services (sources of water, solid waste management services, access to sanitation, access to roads, etc); Demographics and classifications (basic demographic data and classifications for low-income community areas). Buildings are central to IMIS, functioning as the foundational entities that interconnect all other components essential for efficient municipal service delivery.
The building database in IMIS is established using a GIS framework. High-resolution satellite or drone imagery is used to digitize building footprints, which are then verified through field checks and house-to-house surveys. House-to-house survey also collects all other required attributes data about buildings.
New buildings constructed post-IMIS implementation are recorded through the IMIS mobile application during the building permit process and updated for new constructions. The app, currently available for Android, captures building footprints and related data for new structures. Additional building attributes are updated during municipality’s business process in delivering various services such as sanitation assessments, sanitation service delivery and other services. However, this needs to be incorporated into the municipality’s service delivery policy.
BIMS provides an interactive dashboard dedicated to building related information. This dashboard provides visual insights into building data from multiple perspectives. BIMS provides comprehensive interfaces and tools for data entry, updates, queries, and analysis. The system has a map-based integration feature that provides geospatial visualization tools for location identification. The module has data extraction tools that have capability for generating data in various formats, including CSV, Shapefiles, and KML files.
BIMS offers municipalities valuable insights into Building infrastructure status, utility and service access and the critical data for planning, management and monitoring and evaluation of sanitation system and services in CWIS approach.
The data maintained by BIMS helps municipality to monitor the CWIS indicators such as (i) % of LIC population with access to safe individual toilets / % of total population with access to safe individual toilets, (ii) Population with access to safe individual toilets, and (iii) Low-income community (LIC) population with access to safe individual toilets.
1.2.2 Utility Information Management System (UIMS)
UIMS, a core module of the IMIS, is designed to manage detailed spatial and attribute data for municipal utilities such as roads, stormwater drains, water supply networks, and sewer systems. UIMS plays a critical role in achieving CWIS by enabling municipalities to monitor sanitation infrastructure, identify service gaps, and ensure equitable access to sanitation services, particularly for low-income community (LIC) areas. Through its integration with the BIMS, UIMS provides granular insights into utility connectivity for each building, including sewer and drainage links, and water supply access. This integration helps municipalities target underserved areas, plan infrastructure expansions, and prioritize investments in sanitation services.
A key feature of UIMS is its interactive dashboard, which delivers real-time visualizations on sanitation-related utilities. The system empowers municipalities to monitor sanitation coverage trends, identify gaps, and make data-driven decisions to address inequities in service delivery. UIMS also includes advanced map-based input tools integrated with the UMDSS, allowing municipalities to add or update utility infrastructure directly within the platform. Currently this tool is available for creating and updating roads only. In the case of other utilities, they need to be digitized and merged with existing data and import in corresponding utilities database of IMIS with the help of skilled GIS people. In the case of attribute data, they can be updated for all kinds of utilities directly from the user interface. UMDSS has provided tools to export data in flexible formats, such as CSV, SHP, and KML ensuring seamless sharing and integration with other municipal services.
1.2.3 Faecal Sludge Information Management System (FSIMS)
The FSIMS is another core and most important module CWIS. This module enables municipality to digitalize and manage all data related to sanitation systems and services. FSIMS digitalize the complete sanitation service chain from application request for emptying service to the safe disposal of faecal sludge at the treatment plant and the reuse of the treated waste.
The FSIMS is further categorized into five sub-modules:
a. FSM Dashboard (FSMD): The FSMD provides information related FSM services, overall, from containment emptying to transfer and disposal of waste in the FSTP. FSMD provides information about the number of containments; service providers; resources used for service delivery; applications received and responded; containments emptying status, volume of sludge collected, emptied and disposed; and the revenue generated,
b. Containment Information Management System (CIMS): The CIMS maintains the information about the containments in the city, with their location information and attribute information such as building identification number (in case of multiple building served one containment, BIN of main building responsible for taking care of the containment), sanitation system type, dimensions, volume, last emptying date, next emptying date, etc. If a building is connected to a sewer network, that information is maintained in the building database. However, this module does not include a separate feature for adding new containments, if new containment must be added, it has to be updated in corresponding building in building database, through BIMS. A containment may be shared by multiple buildings or vice versa.
c. Service Provider Information Management System (SPIMS): The SPIMS maintains the information related to the sanitation service providers registered with the city that provide emptying services within the city. This information is maintained by municipal authority whereas, two other functionalities employee information and desludging vehicles for service provider to maintain their information about their employees and the desludging vehicles. Only those service providers, employees and vehicles registered in this system are eligible to provide emptying, transporting and disposing faecal sludge in the FSTP or area designated by the municipality. This information helps municipality and service providers for efficient management of the resources and efficient service delivery. The information provided by SPIMS also helps monitoring KPIs set by municipality for service providers and tracking emptying vehicles to ensure that the waste emptied from the containment is transported and disposed in the area designated for disposing waste or FSTP allocated by the municipality.
d. Treatment Plant Information Management System (TPIMS): The TPIMS maintains the information related to the treatment plants that could be FSTP, Centralized Wastewater Treatment Plant, Decentralized Wastewater Treatment Plant or Co-treatment Plant, those used by the city to dispose and treat collected faecal sludge or wastewater. In addition to this, this sub-module also maintains water sample test data with the standard parameters used for monitoring the performance of the treatment plants in the city.
The information maintained by TPIMS along the information maintained by BIMS and the ESIMS, helps municipal to monitor the CWIS indicators such as (i) FS treatment capacity as a % of total FS generated from non-sewered connections, (ii) FS treatment capacity as a % of volume disposed at the treatment plant, (iii) WW treatment capacity as a % of total WW generated from sewered connections and greywater and supernatant generated from non-sewered connections, and (iv) Effectiveness of FS treatment in meeting prescribed standards for effluent discharge.
e. Emptying Service Information Management System (ESIMS): The Emptying Service IMS digitalizes the sanitation service chain and enables the city to manage the entire sanitation service chain, starting from application requests for emptying service from the customer to the safe disposal of faecal sludge at the treatment plant. All the activities involved in this process can be monitored in real-time through ESIMS. The module is divided into four categories according to the different stages of the sanitation service chain i.e. application, emptying, sludge collection and feedback. The complete service chain is managed and maintained through the application section; however, the individual sections maintain further detailed information. There are several functional modules under this sub-module:
§ Application – this functional module is accessible to helpdesk and FSTP operator. The helpdesk uses it for receiving and maintaining application for customer’s emptying request and collecting and maintain feedback data. FSTP operators use it for updating sludge transferred from the emptied containment and disposed in the FSTP. There is a function to generate reports of emptying service under this functional module. Helpdesks generally are the part of the municipality’s sanitation department, emptier are part of the service providers and FSTP operators can be part of the municipality or the private operator as of municipality’s policy.
§ Emptying – there is an easy-to-use native mobile application (android) that allows collection of the emptying information while providing the emptying service, such that the information can be updated in real-time. The mobile application is used by emptier to collect the information such as emptying start and end time, number of trips, total cost for emptying, and the payment receipt number. Emptying details can be viewed in real-time by the help desk and other municipal staff who have access to this module.
§ Sludge collection – FSTP operator in FSTP updates the FS disposal record that includes date, time and volume of waste disposed in the FSTP through the functional module Application through the web app as the waste is transferred and disposed in FSTP. Help desk can view these records in real-time through this functional module.
§ Feedback – this functional module is accessible to the helpdesk, after completing sanitation service chain from emptying to disposal of the waste in the FSTP.
§ Help desks – this functional module is used to create help desk and update their information. Help desks generally are under municipality itself, but the system has the capability of managing multiple help desks.
Data maintained by FSIMS along with the building data and LIC data enables CWIS Information Management System to generate CWIS indicators such as (i) IHHL onsite sanitation system that have been desludged, (ii) Collected FS disposed at the treatment plant or designated disposal site, (iii) Low income onsite sanitation systems that have been desludged, (iv) FS collected from LIC that is disposed at treatment plant or designated area, (v) Educational institutions where FS generated is safely transported to TP or safely disposed in situ, (vi) Healthcare facilities where FS generated is safely transported to TP or safely disposed in situ, and (vii) Desludging services completed mechanically or semi-mechanically.
The data export tools under FSIMS allow users to export data in CSV, Shape and KML format where applicable.
1.2.4 Community Toilet / Public Toilet Information Management System (PTCTIMS)
The PTCTIMIS is another core module of the system that maintains the information about the Public Toilets (PT) and Community Toilets (CT) in the city. The module enables municipal authority to maintain geographic locations of the PTs and the CTs in the city with their capacities and facilities along with daily user logs in case of PTs. In the case of CTs, PTCTIMS maintains the number of households and the population served by CTs, based on the household and population data maintained by building databases in the system. Data export feature of the module enables users to export data PT/CT data in CSV format. Mapping features of UMDSS with this data enables municipal authorities to map the locations of the PTs/CTs with their operational condition and it has also provided a tool to map the buildings which are served by a specific CT.
CT information along with building information maintained by PTCTIMS helps monitoring four major CWIS indicators (i) Dependent population with access to safe shared facilities, (ii) Shared facilities that adhere to principles of universal design, (iii) Shared facility users who are women, and (iv) Average distance from household to shared facility. Similarly, PT information along with containment emptying data enables municipal authority to monitor CWIS indicators (i) PT where faecal sludge generated is safely transported to treatment plant or safely disposed in situ, (ii) PT that adhere to principles of universal design, and (iii) PT users who are women.
1.2.5 Sewer Connection Information Management System (SCISS)
The SCISS is a core module that enables the city to maintain information on new sewer connections established between a building and sewer network within the city. This module provides a native mobile application (android) that allows the collection of the unique ID of both the building and the corresponding sewer network through a field survey. The collected building ID as well as sewer ID are maintained by this module, and once approved it is reflected in the BIMS, which updates the sanitation system and utility information of the building.
1.2.6 Public Health Information Support System (PHISS)
PHISS is another core module of the IMIS, designed to empower municipalities in monitoring and addressing public health and sanitation challenges. PHISS enables the collection and maintenance of water sample data from various sources, including groundwater, surface water, and treated wastewater, to ensure compliance with water contamination standards. This functionality directly aligns with the CWIS objective of monitoring environmental outcomes associated with sanitation systems. Additionally, PHISS records and tracks cases of waterborne diseases across the city, providing municipalities with crucial data to understand and mitigate public health risks.
One of the standout features of PHISS is its ability to maintain spatial and attribute data related to hotspot areas where waterborne diseases, such as diarrhea, cholera, dysentery, and typhoid, have been detected. The system also tracks fatalities linked to these diseases, offering a comprehensive overview of the impact on affected households and populations. By integrating this information with the UDSS municipal authorities can conduct detailed analyses of disease prevalence and its underlying causes. This data-driven approach enables strategic planning, targeted interventions, and efficient allocation of resources to reduce health risks in vulnerable areas.
Water sample data and waterborne cases data maintained by PHISS helps municipality to monitor the CWIS indicators (i) Water contamination compliance of the water sources such as groundwater, surface water and treated wastewater, and (ii) Incidence of faecal-oral pathway diseases (e.g. diarrhea, cholera, dysentery and typhoid). With this information, municipalities can assess the effectiveness of sanitation systems in protecting public health and identify areas requiring urgent attention. By addressing these indicators, PHISS supports municipalities in achieving CWIS objectives, ensuring safe water quality and reducing the prevalence of sanitation-related diseases. The data export tools under PHISS allow users to export data in CSV, Shape and KML format where applicable.
1.2.7 Property Tax Collection Information Support System (PTCISS)
PTCISS is a value-added module integrated into the Integrated Municipal Information System (IMIS), designed to help municipalities monitor and manage property tax collection citywide through powerful map-based visualization tools. It enables city authorities to import property tax data maintained by the municipal property tax collection department into IMIS using a user-friendly data import tool supporting CSV formats. Once the data is integrated, property tax collection information is displayed in graphical formats on the IMIS dashboard and visualized on maps using tools provided by UMDSS. This facilitates quick and intuitive analysis of tax collection status across various parts of the city.
Mapping property tax data provides actionable insights by identifying high-default areas (regions with a significant number of defaulters) and efficient collection zones (areas with fewer defaulters or higher compliance rates). These insights enable the property tax department to focus on areas requiring attention, thereby improving efficiency and compliance. The information generated by PTCISS empowers city authorities to engage in strategic planning and evidence-based decision-making, allowing them to: (a) develop better tax collection strategies, (b) formulate effective policies to increase compliance, and (c) plan for equitable tax management across different city regions.
PTCISS also includes Data Export Tools, enabling municipal authorities to export building data along with their tax payment status. Additionally, it highlights mismatched tax records between the building data maintained in IMIS and the input tax data provided by the property tax department. This functionality helps identify and resolve discrepancies, ensuring data accuracy and transparency.
Currently, PTCISS relies on periodic manual updates using CSV-based imports to maintain data accuracy. However, the system is designed to be future-ready, with the capability to support real-time data integration through an API if the city’s property tax collection system provides connectivity access. This upgrade would enable automated and efficient data synchronization as municipal technology evolves.
By leveraging the features and insights provided by PTCISS, municipalities can streamline property tax management, improve transparency, and enhance revenue collection efficiency. These improvements contribute significantly to better urban governance and equitable service delivery.
1.2.8 Solid Waste Information Support System (SWISS)
The SWISS that enhances the management of solid waste services and fee collection. The module includes a tool for importing a municipality’s solid waste customer data, including their last solid waste management service fee payment date, in CSV format. Based on this imported data, the SWISS module generates and maintains solid waste management customer records in IMIS, along with their fee payment status. It also provides tools to export building data with their solid waste service fee payment status and identifies discrepancies by highlighting records that exist in the municipality’s solid waste customer database but are missing from IMIS.
Using the imported data, UMDSS in IMIS helps municipal authorities map buildings with or without solid waste management services and their respective fee payment statuses. This mapping capability enables municipalities to monitor service coverage, assess the status of fee collections, and identify geographic trends in solid waste management service delivery. By integrating solid waste management customer data with building records in IMIS, the SWISS module equips municipal authorities with actionable insights to make informed decisions regarding solid waste services.
The visualized data provided by SWISS supports municipalities in formulating policies to enhance the solid waste management service and fee collection processes. It also aids in optimizing resource allocation and improving overall service delivery by identifying areas requiring attention or adjustments. This integration is currently carried out manually on a periodic basis to ensure the data in IMIS remains up to date. Like the PTCISS module, SWISS does not yet support real-time data integration through an API.
1.2.9 Water Supply Information Support System (WSISS)
The WSISS is another value-added module within the IMIS, designed to enhance the management of water supply services and fee collection. The WSISS includes a data importing tool that allows municipalities to upload water supply customer data, including their last fee payment date, in CSV format. Based on this imported data, the WSISS module generates and maintains records of water supply customers along with their fee payment status. It also provides tools to export building data with their water supply service and fee payment statuses and highlights discrepancies by identifying records present in the municipality’s water supply customer database but missing in IMIS.
Using the imported data, the UMDSS in IMIS enables municipal authorities to visualize the water supply fee payment status of buildings in maps of the City within IMIS. This capability allows municipalities to monitor fee collection statuses and assess geographic trends in water supply fee payments. By integrating water supply customer data with building information in IMIS, the WSISS module equips municipal authorities with actionable insights to make informed decisions regarding water supply services.
The visualized data provided by WSISS supports the development of policies aimed at improving water supply fee collection processes, optimizing resource allocation, and enhancing overall service delivery. This integration helps municipalities target areas requiring attention, ensuring more effective and equitable water supply service management.
Currently, as with the PTCISS and SWISS modules, the integration of data into WSISS must be carried out manually on a periodic basis to maintain accuracy.
1.2.10 Urban Management Decision Support System (UMDSS)
The UMDSS is one of the core and powerful tools in IMIS, it provides advanced capabilities for spatial analysis, mapping, data export, and dashboard visualizations. These tools empower city authorities to engage in evidence-based planning, management, monitoring, and decision-making for planning, management and monitoring and evaluation of sanitation system and services as well as a broader municipal urban management activity. In addition to the UMDSS module, there are IMIS Dashboard, Building Dashboard under BIMS, FSM Dashboard under FSIMS, Utility Dashboard of IMIS, CWISIMS Module including CWIS and KPI dashboard under CWISIMS are also has been considered as the components of UMDSS.
i. UMDSS
The UMDSS provides Export Data and Map Feature Sub-modules.
Export Data:
§ The Export Data sub-module enables users to export data layers in flexible formats such as SHP and KML. Users can customize exports by selecting specific ward(s) or combining layers to suit their needs.
Map Feature:
§ The Map Feature is a powerful interactive map interface which provides a dynamic platform to visualize and analyze spatial data created by various modules and sub-modules in IMIS. It displays all spatial information with categorical styling based on attribute information, presenting summarized layers at city, ward and 0.5 km grid levels.
§ The interface includes various spatial and complex tools that provide both basic and advanced functionalities, catering to a wide range of municipal operations. From navigation and visualization to sanitation-specific analyses and data updates, these features enhance decision-making by offering precise and actionable insights. These tools are – (i) Navigation and Map Interaction Tools (Zoom In & Zoom Out, Municipal Extent, Navigate, Info, Coordinate Information, Locate Point by Coordinate, (ii) Measurement Tools (Measure Distance, Measure Area), (iii) Printing and Support Tools (Print Map, Help), (iii) Sanitation-Specific Analysis Tools (Find Nearest Road, Find Building Connected to Containment, Find Containment Connected to Building, Find Associated Building, (iv) Editing Tools (Add Roads, Remove Markers).
The integration of tools like Find Nearest Road and Containment Analysis directly supports Citywide Inclusive Sanitation (CWIS) goals, while features like Measure Area, Print Map, and Add Roads contribute to broader urban management and planning efforts. By using these tools, municipal authorities can efficiently monitor sanitation systems, plan infrastructure upgrades, and ensure equitable service delivery across the city.
§ UMDSS also offer some specialized tools – (i) Service Delivery Tools for tracking (Applications, Emptied Applications Not Reached to Treatment Plant, Containments Proposed to Be Emptied, Feedback Chart (FSM Service Quality), (ii) General Tools for tracking (Buildings by Structure Type, Property Tax Collection, Water Supply), (iii) Data Export Tools (Filter by Wards, Export Data Set, Building Owner Information), (iv) Decision Tools (Tax Due Buildings, Sewers Potential Buildings, Buildings to Sewer, Buildings to Road, Hard to Reach Buildings, Building Close to Water Bodies, Buildings Using Community Toilets, Area Population), (V) Summary Information Tools (Summary Information Buffer Filter, Water Bodies Buffer Summary Information, Wards Summary Information, Road Buffer Summary Information, Point Buffer Summary Information).
These tools enhance decision-making by providing targeted insights into property, utility, and demographic data. They allow municipalities to analyze specific areas, prioritize interventions, and support efficient planning, management and monitoring and evaluation of CWIS sanitation system and services, and overall urban management.
ii. CWIS Information Management System (CWISIMS):
CWISIMS is a vital module of the IMIS that provides tools to generate CWIS indicators for the city and Key Performance Indicators (KPIs) to monitor the performance of sanitation service providers for a specified year. CWISIMS allows municipalities to set targets for each indicator in alignment with city policies and standards, and it includes a dashboard for the visualization of these indicators. The generated indicator data is maintained in a database, enabling easy access and review when needed, ensuring effective monitoring and planning.
CWIS Dashboard - The CWIS Dashboard tracks 22 sanitation indicators (Annex 1), which are generated annually. These indicators are informed by data maintained across various modules and sub-modules within IMIS, making them integral to understanding citywide sanitation performance. The indicators are based on the CWIS framework developed by Athena Informatics, ensuring consistency with globally recognized standards for inclusive sanitation monitoring. This dashboard provides municipalities with a centralized platform for tracking sanitation progress and assessing the effectiveness of implemented policies and services.
KPI Dashboard – The KPI Dashboard complements the CWIS Dashboard by focusing on the performance of sanitation service providers. It monitors seven critical KPIs (1. Application Response Efficiency, 2. Customer Satisfaction, 3. PPE Compliance, 4. Safe Desludging, 5. Faecal Sludge Collection Ration, 6. Response Time, 7. Inclusion), which are also generated annually, using sanitation service data related to faecal sludge management (FSM) service delivery. These KPIs are designed to evaluate the efficiency and quality of services provided by sanitation operators, based on metrics developed by SNV Bangladesh. By leveraging this dashboard, municipalities can benchmark service provider performance and identify areas for operational improvement within their sanitation systems.
CWISIMS, through its dual focus on CWIS indicators and KPIs, provides municipalities with robust tools for monitoring and improving their sanitation systems. By aligning indicator and KPI tracking with international standards and municipal goals, it ensures data-driven decision-making and continuous improvement in sanitation service delivery and management.
1.2.11 Settings
This is a module to allows administrators to manage user access and control permissions within the system. Features include:
User Credentials - Securely store and manage user authentication details, including usernames, passwords options.
Roles Management- Create and assign roles to users, defining their access level and responsibilities. Roles can be customized to reflect specific job functions.
Permissions Control - Fine-tune access by assigning permissions to roles or individuals, ensuring users can only interact with data and features relevant to their role.
Accessing the IMIS
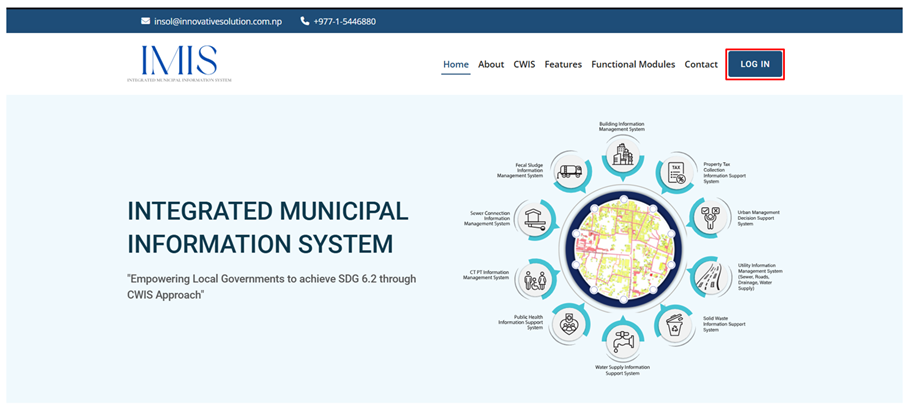
When accessing the IMIS web application through a browser, users are directed to the landing page, which provides a general overview of IMIS. To proceed, users can click on the 'SIGN IN' button, triggering a pop-up where they are prompted to enter their login credentials. The IMIS web application is compatible with all major browsers.
- Open any browser to access the IMIS Web Application. (For better user experience Chrome Browser is recommended)
- Enter the provided IMIS URL to navigate to the Home Page.
Overview:
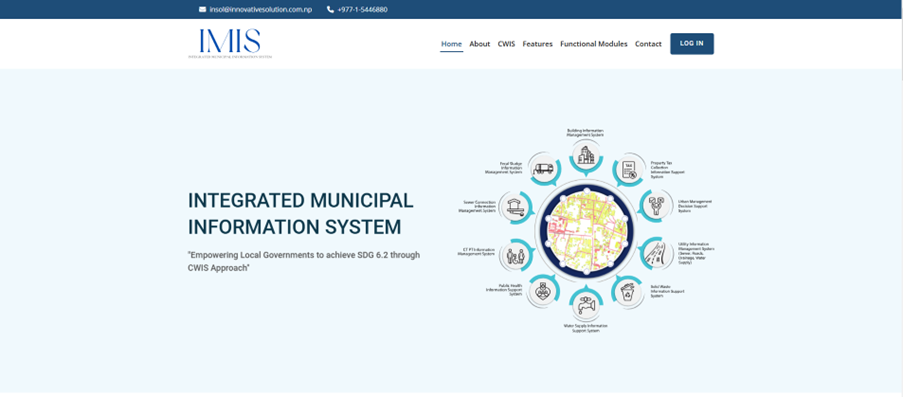
Figure 2- 1 IMIS landing Page
The Home Page of IMIS has the following sections:
· Home - The “Home” provides the diagrammatic representation of the functional modules of IMIS and serves as the starting point where the website loads.
· About – The “About” contains the short synopsis on IMIS.
· CWIS – The “CWIS” (Citywide Inclusive Sanitation) section provides the brief on what CWIS is, its approach and the CWIS.
· Features – The “Features” section showcases the key functionalities of IMIS
· Functional Modules – The “Functional Modules” highlights the features and functions of each module.
· Contact – The “Contact” provides direct contact with the technical partner of the IMIS
· LOG IN – The “LOG IN” section is a login portal for registered users or members.
2.2 Log In to IMIS
· Click on the “LOG IN” button
· Enter the valid username or email and a password provided, then click on the Log In button.
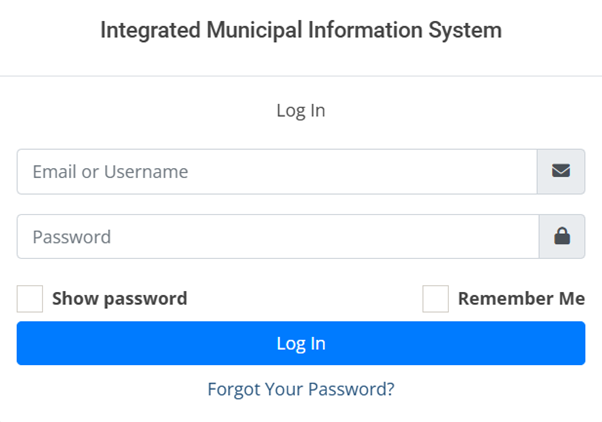
Figure 2- 2 Login Prompt
Overview:
· After successfully logging in, the user is redirected to the IMIS Dashboard.
If the user wants to stay logged in, check the “Remember Me” option (refer to section 2.4 Remember Password
2.3 Resetting Password
· The user can reset their password by Clicking on the Forgot Your Password? hyperlink.
· The Reset Password Page is displayed where the user is prompted to fill in the user’s correct email ID and select the Send Password Reset Link.
· A link to reset the user’s password is sent to the corresponding email ID.
· The user needs to follow that link and reset their password.
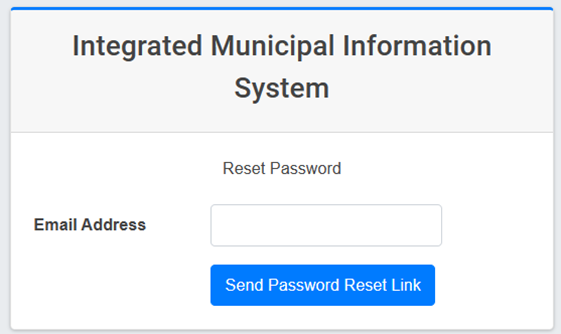
Figure 2- 3 Reset Password Prompt
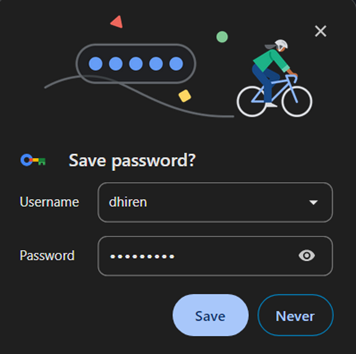
2.4 Remember Password
· Instead of entering the password repeatedly, the user can save it for convenience.
· The user can check the “Remember Me “checkbox which is available on the SIGN IN form.
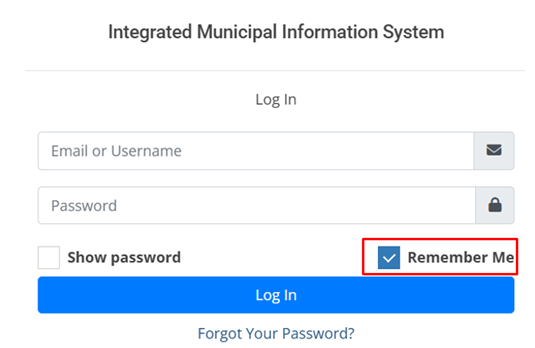
· The password will be saved in the user’s browser.
· The save password prompt is displayed after the user checks the “Remember Me” checkbox and signs in.
Dashboard
There are all together six Dashboards considered as the components of UMDSS of the IMIS that serve as its core components: (i) IMIS Dashboard, (ii) Building Dashboard, (iii) FSM Dashboard, (iv) Utility Dashboard, (v) CWIS Dashboard, and (vi) KPI Dashboard. Five of these dashboards have been discussed under their respective functional modules and sub-modules. The remaining dashboard, the IMIS Dashboard, is detailed below.
The IMIS Dashboard serves as the central platform within the IMIS, offering a comprehensive overview of municipal data. It integrates information on building infrastructure, utilities (such as roads, drains, sewer, and water supply), sanitation systems and services, public and community toilets, public health, tax collection, water bill payments, and solid waste management. This dashboard provides municipalities with a unified interface for monitoring and managing citywide operations effectively, supporting informed decision-making and efficient service delivery.
The Urban Management Decision Support System (UMDSS) enables municipalities to implement Citywide Inclusive Sanitation (CWIS) principles, supporting the planning, monitoring, and management of sanitation systems and services through a CWIS-focused approach. It also enhances revenue collection processes, including tax collection, water bill payments, and fees for solid waste management services, while providing actionable spatial insights to improve overall urban management. With its powerful analytical tools, UMDSS empowers municipalities to achieve greater efficiency, transparency, and inclusivity, not only in sanitation management but also in broader urban governance and service delivery,
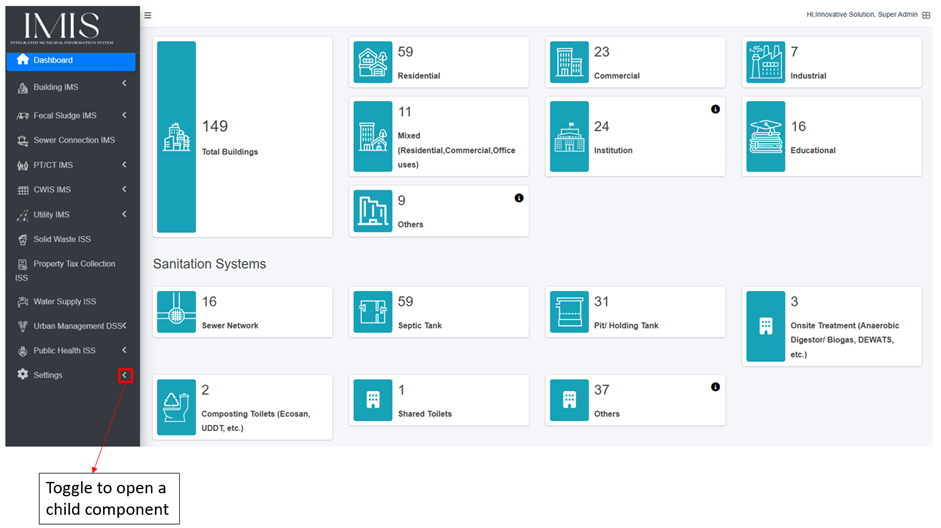
Figure 3- 1 IMIS Dashboard
Sidebar
1. Dashboard
2. Building IMS
3. Fecal Sludge IMS
4. Sewer Connection IMS
5. PT/CT IMS
6. CWIS IMS
7. Utility IMS
8. Solid Waste ISS
9. Property Tax Collection ISS
10. Water Supply ISS
11. Urban Management DSS
12. Public Health ISS
13. Settings
Filters
Each sub-module that displays records includes a range of filters based on the attributes maintained by the module or page. These filters enable users to refine and sort information according to various attributes specific to the records. Additionally, the export tool is fully compatible with these filters, ensuring efficient and accurate data export.
Initially, all filters are hidden. Select the Show Filter button to expand the filter.

Figure 5- 1 Filter Toggle
Overview:
· The user must select the Show Filter button to view the filter.
· Enter its appropriate value and click on the Filter button. E.g., Structure Type > RCC Framed and Ward >Ward 1.
· To remove the filter, click Reset.
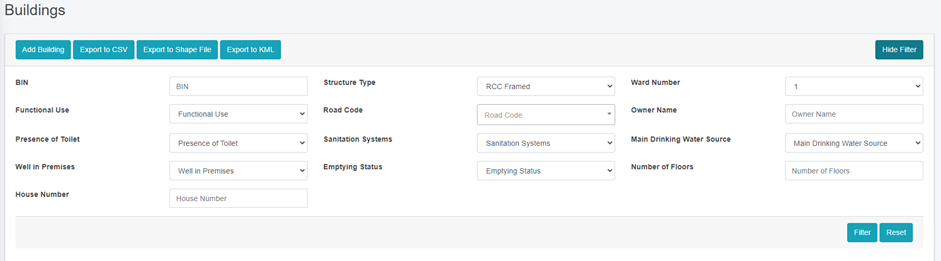
Figure 5- 2 Filter Search Fields
· The filtered data using the multiple search fields is shown below (e.g. Structure Type: Load Bearing, Functional Use: Agricultural & Farm and Sanitation Systems: Septic Tank)
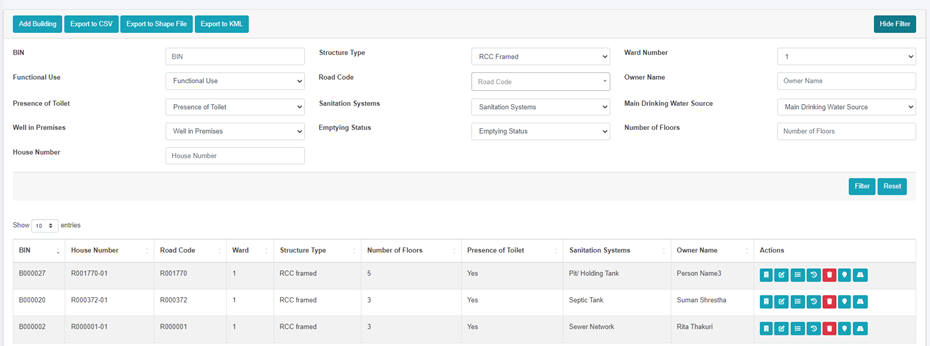
Figure 5- 3 Multiple Fields using Filter
Actions
This chapter elaborates various actions that can be performed on each module by the users. These actions are restricted by user’s role and permissions.
List of Actions
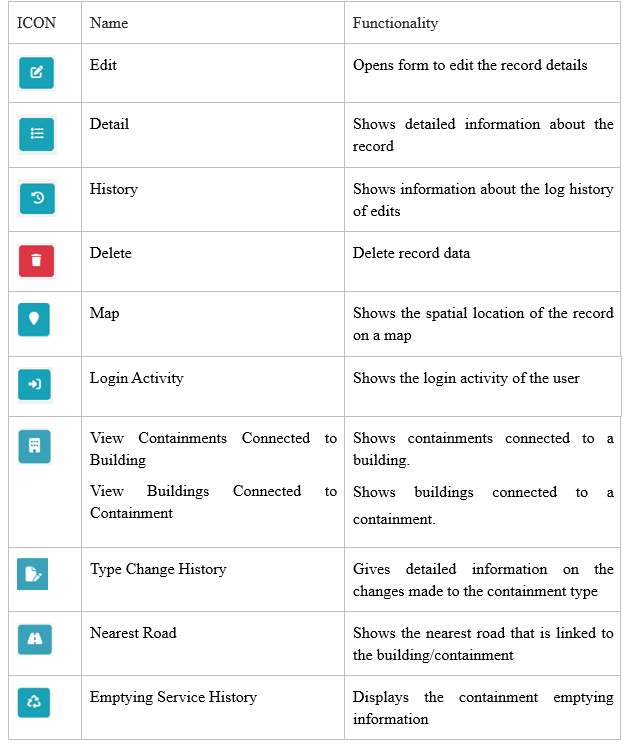
Table 6- 1 List of Actions
6.1 Edit Record
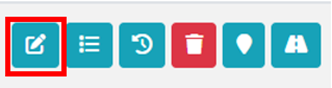
· Click on Edit in the Action column of the List.
- Change the values of the desired form fields and click Save.
Overview:
· Users can select the edit button to add information to empty fields or modify existing entries as needed.
· Click on the Back to List button if the user does not want to save any changes.
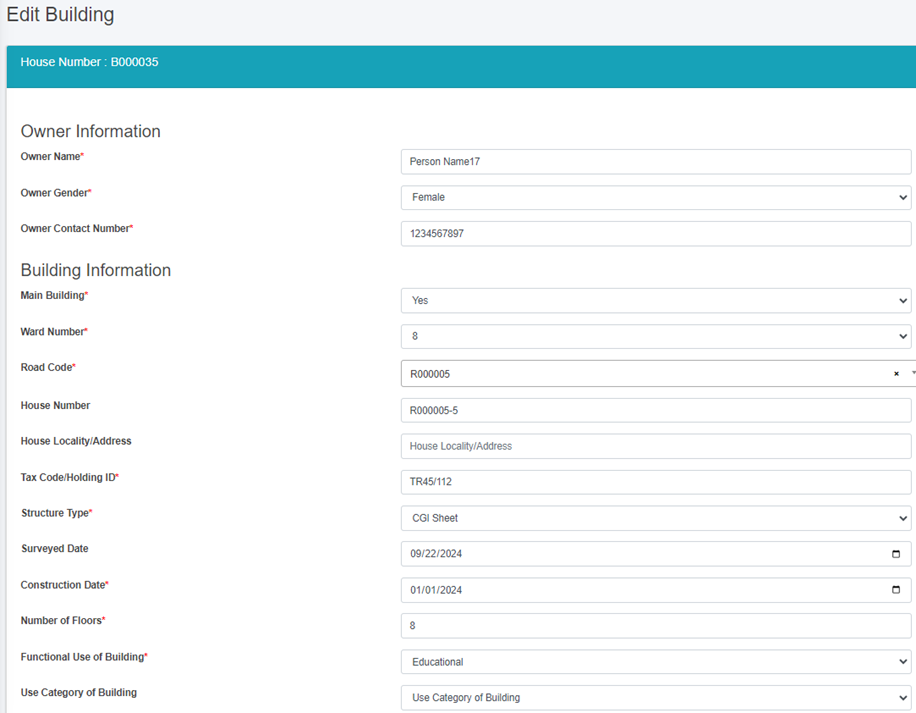
Figure 6- 1 Edit Record
Note:
If the user gets the validation message during the Edit of any fields in the form, user must input correct data.
6.2 View History
· Click on the History button in the Action column of the List.

Overview:
· Users can view the changes made to the individual attributes of the record, including the user who made the record, the values that were edited, and the timestamp when it was edited.
· Click on “Back to List” to go back.
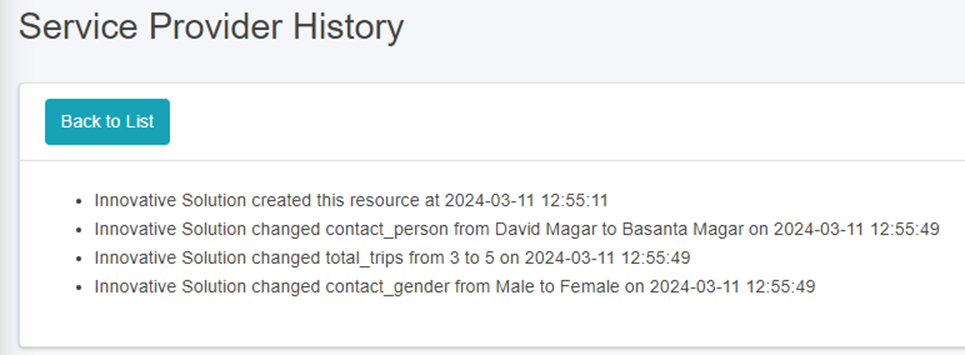
Figure 6- 2 Record History
6.3 Delete Record
· To delete a record, click on the Delete button in the Action column of the list.

Overview:
· After clicking the delete button, it will display a confirmation dialog. Click the ‘Yes, delete it!’ button in the confirmation dialog to delete the record.
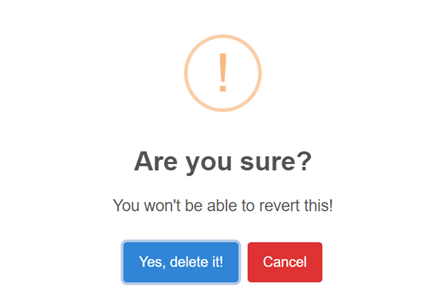
Figure 6- 3 Delete Confirmation Dialog
Note: Once deleted, the record cannot be recovered by the user. The alternative to deleting is to change the record’s status to inactive/non-operational if the status field is available. This way, the user won’t need to delete the record.
The records that are deleted through the interface can be retrieved in cases of accidental deletion. Please contact the technical support team if such events occur.
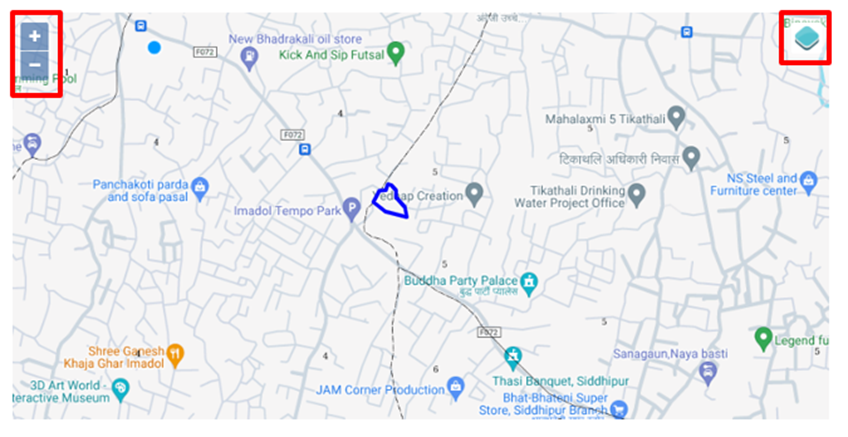
6.4 View on Map
- Click on the Map button in the Action column of the List to view the spatial location of the record with a marker.

Note:
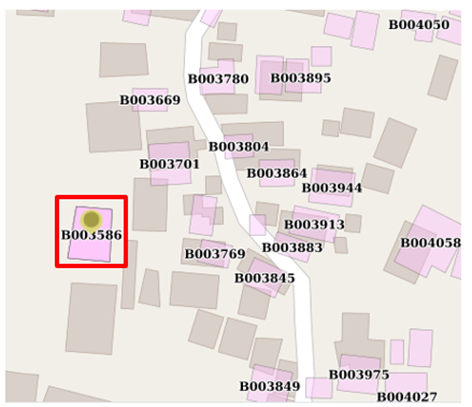
Figure 6- 4 View on Map
6.5 Show Details of Record
· Click on the Detail button in the Action column to view the attribute information maintained for the record.

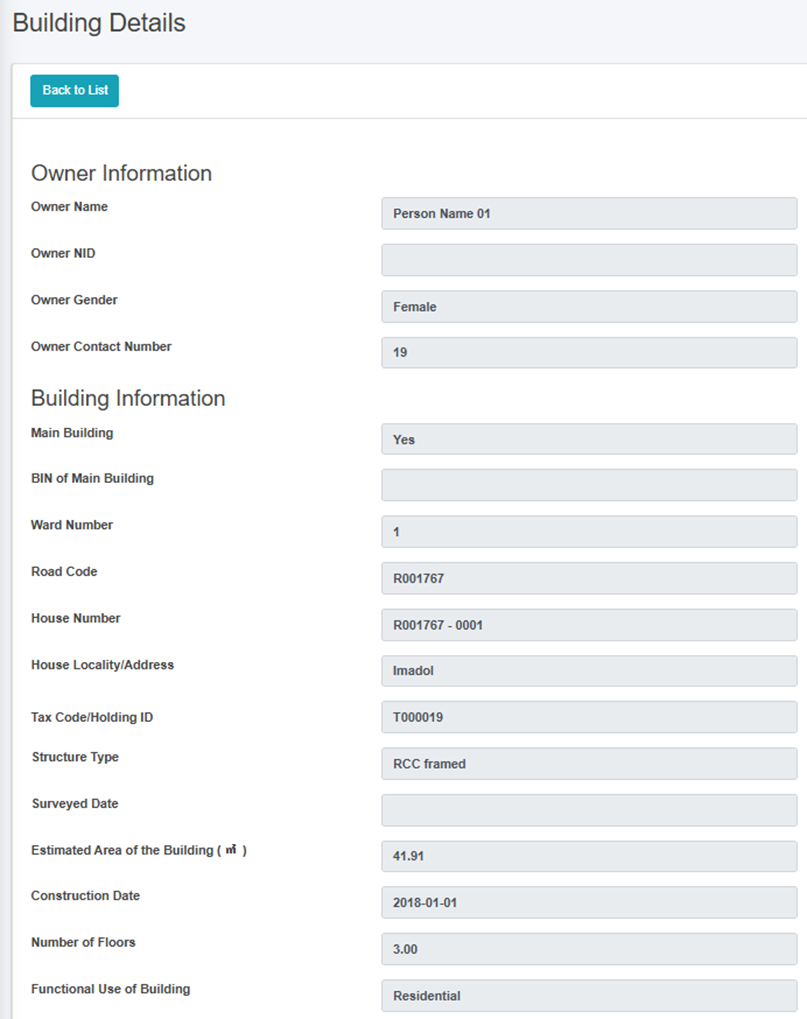
Figure 6- 5 Record Details
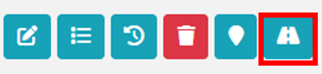
6.6 View Nearest Road of Record
· Click on the Nearest Road button, to view the nearest road that links to the building/ containment.
Note:
View Nearest Road of Record is available only in the Building/ Containment Module.
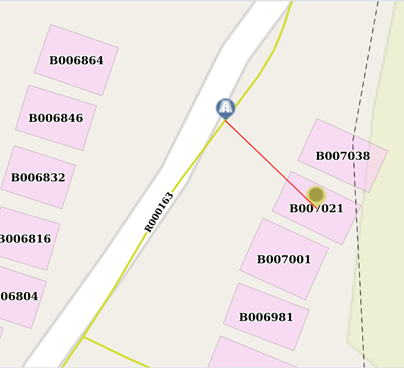
Figure 6- 6 View Nearest Road
6.7 View Login Activity
· Click the Login Activity button in the Action column of the list to view the last login times and their IP addresses.
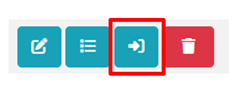
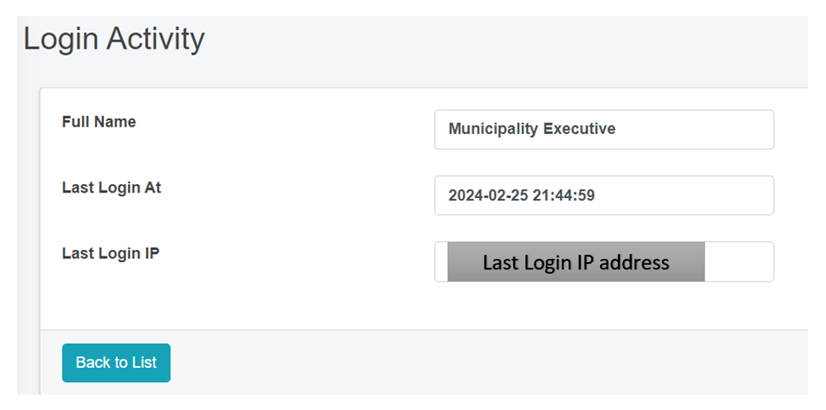
Figure 6- 7 Login activity
Note:
-
View login activity is available only in the Users module.
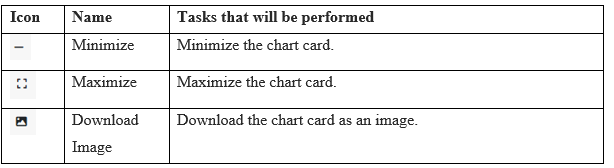
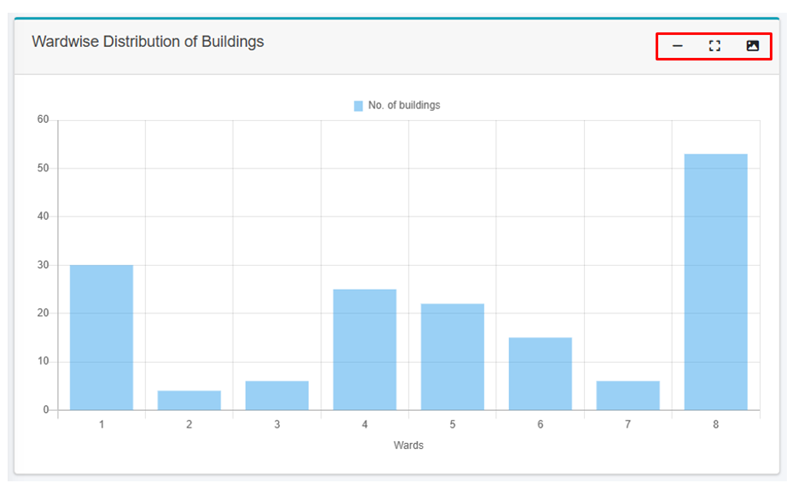
6.8 Chart Card Tools
The user can undertake diverse actions using the chart card tools, including minimizing and maximizing the chart. Furthermore, the option to download the chart as an image enhances the user's capability to evaluate the information.
System Notifications
7.1 Save
After the User fills out a form and Clicks Save, the user with a green pop-up message indicating successful form submission as shown below:
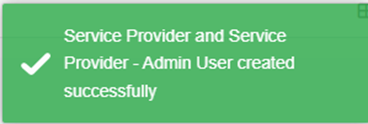
Note: The above pop-up message is just an example, and the wording may differ according to the form filled.
7.2 Validation Message Box
If the user enters incorrect data while filling out the form in add /edit page, the system will display a red-highlighted validation message box. Additionally, if a mandatory field is left blank, it is remarked with a red asterisk (*), and the system will notify the user with the following error message:
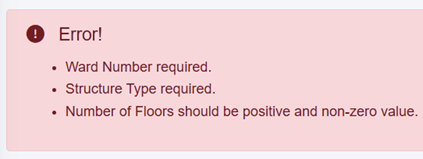
Note: The above pop-up message is just an example, and the wording may differ according to the form filled.
7.3 Successfully Imported
When the user imports a CSV file, this will validate the data against the existing system data and provide a message as:
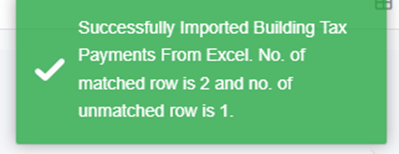
Note: The above validation message box is just an example, and the wording may differ according to the type of document imported.
7.4 Import Format Error
If the User attempts to import data in an invalid format, the system will notify the user with an error message as shown below:
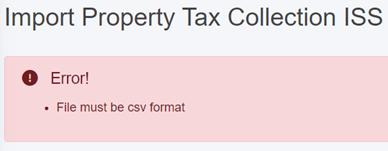
Note: The above validation message box is just an example, and the wording may differ according to the type of document imported.
Tools
In each sub-module where records are listed, there are various tools available that allow the user to Export the records in various formats and add new records. Additional tools are present in certain sub-modules as per the functionalities. Data from each sub-module can be exported in three different file types: CSV, KML (if GIS information is maintained), and Shape File (if GIS information is maintained). It should be mentioned that the Export tool integrates perfectly with the Filter tool, enabling the user to filter out the necessary data and export it as well.
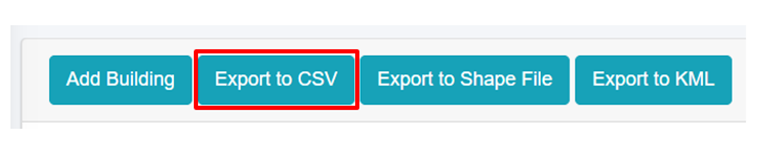
8.1 Export to CSV
Click the Export to CSV button to download the CSV file.
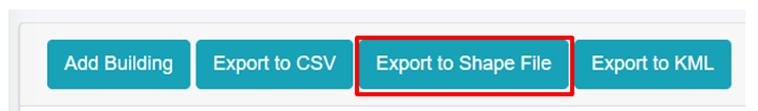
8.2 Export to Shape File
Click the Export to Shape File button to download the shape file.
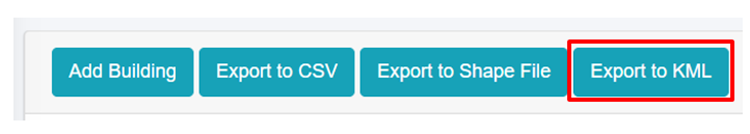
8.3 Export to KML
Click the Export to KML button to download the kml file.
8.4 Export Unmatched Records
- Click the Export Unmatched Records button to download the CSV file.
- When data imported from CSV file is compared with the building data in IMIS, it helps determine whether the buildings have paid their taxes. If not, it also identifies the number of due years. Additionally, various tools and map views enable users to analyze and visualize this information effectively.
- If the imported Tax Code, SWM customer ID and Water Customer ID is not found in IMIS, it could indicate that the code or ID is missing in the system, there is an error, or it might be a new tax code and ID. To identify which codes or IDs are either not visible or missing, user can download the unmatched records and review them. Necessary actions can then be taken to verify the code or update it in the system as required.
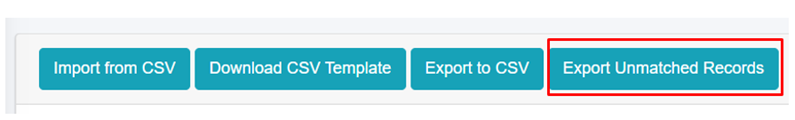
Note:
- The "Export Unmatched Records" button is solely available only within the Property Tax Collection ISS, Solid Waste ISS, and Water Supply ISS modules.
Building Information Management System (BIMS)
About BIMS
The BIMS is a core module of the IMIS that serves as a comprehensive database of all buildings within a municipality. It encompasses detailed information about each building maintained by the Buildings sub-module, including: Physical attributes (structure type, number of floors, and year of construction); Location details (address and geographical coordinates with building footprints; Usage and ownership (Building usage, ownership status, and associated tax codes); Utilities and services (sources of water, solid waste management services, access to sanitation, access to roads, etc.); Demographics and classifications (basic demographic data and classifications for low-income community areas). Buildings are central to IMIS, functioning as the foundational entities that interconnect all other components essential for efficient municipal service delivery.
New buildings constructed post-IMIS implementation are recorded through the IMIS mobile application during the building permit process and updated for new constructions. The app, currently available for Android, captures building footprints and related data for new structures. Additional building attributes are updated during municipality’s business process in delivering various services such as sanitation assessments, sanitation service delivery and other services. However, this needs to be incorporated into the municipality’s service delivery policy.
BIMS provides an interactive dashboard dedicated to building related information. This dashboard provides visual insights into building data from multiple perspectives. BIMS provides comprehensive interfaces and tools for data entry, updates, queries, and analysis. The system has a map-based integration feature that provides geospatial visualization tools for location identification. The module has data extraction tools that have capability for generating data in various formats, including CSV, Shapefiles, and KML files.
BIMS offers municipalities valuable insights into Building infrastructure status, utility and service access and the critical data for planning, management and monitoring and evaluation of sanitation system and services in CWIS approach.
The data maintained by BIMS helps municipality to monitor the CWIS indicators such as (i) % of LIC population with access to safe individual toilets / % of total population with access to safe individual toilets, (ii) Population with access to safe individual toilets, and (iii) Low-income community (LIC) population with access to safe individual toilets.
9.1 Building Information Dashboard
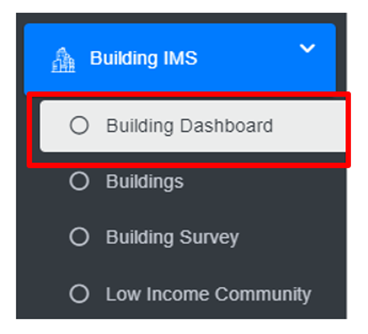
· Open the sidebar and click on Building IMS to expand.
· Select Building Dashboard.
Overview:
· The Building Information Dashboard provides a quick synopsis of the information maintained in this module. The count boxes provide a glance at the status of different buildings, and sanitation systems, and the charts provide a graphical representation of the information.
· The user can interact with the chart’s tools (refer to section 6.8 Chart Card Tools).
· While hovering over the charts, it provides further information.
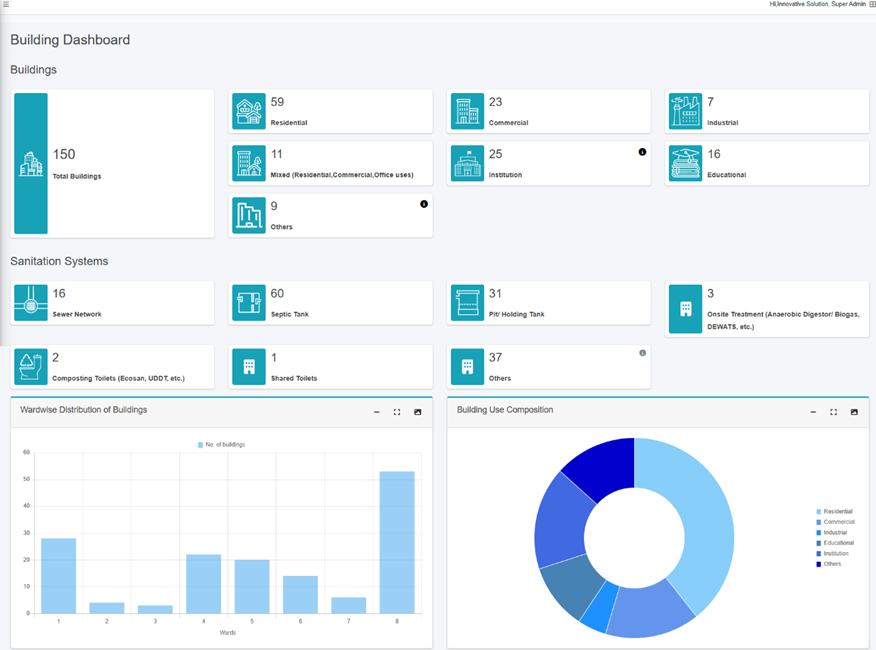
Figure 9- 1 Building Dashboard
9.2 Buildings
The Buildings sub-module maintains the detailed information about each building maintained by the Buildings sub-module, including: Physical attributes (structure type, number of floors, and year of construction); Location details (address and geographical coordinates with building footprints; Usage and ownership (Building usage, ownership status, and associated tax codes); Utilities and services (sources of water, solid waste management services, access to sanitation, access to roads, etc.); Demographics and classifications (basic demographic data and classifications for low-income community areas). Buildings are central to IMIS, functioning as the foundational entities that interconnect all other components essential for efficient municipal service delivery.
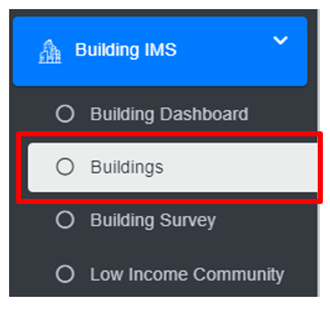
· Open the sidebar and click on the Building IMS to expand.
· Select Buildings.
Overview:
The Buildings Page lists all the attribute records stored in the module and provides different Tools, Actions and Tools that can be used according to the requirements. For more details (refer to section 5 Filters, section 6 Actions and section 8 Tools).
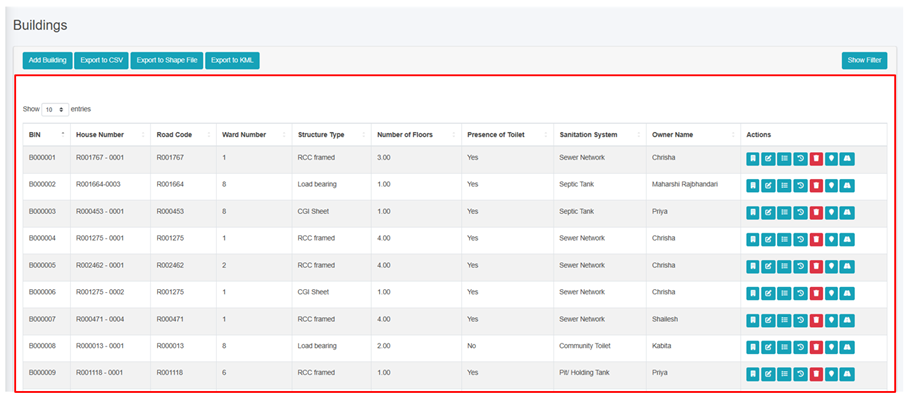
Figure 9- 2 List Buildings page
9.2.2 Add Building
· Click on the ‘Add Building’ button.
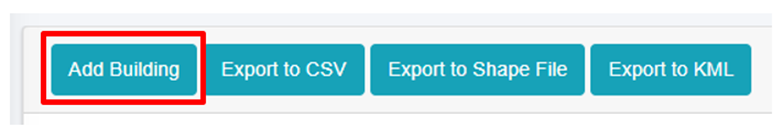
· User will be redirected to the following page:
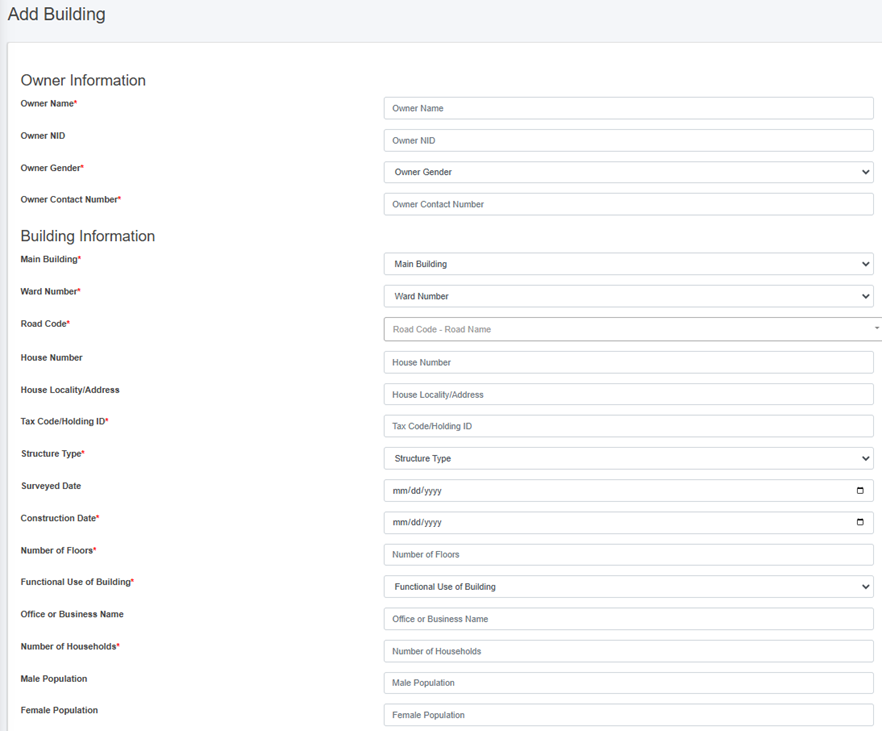
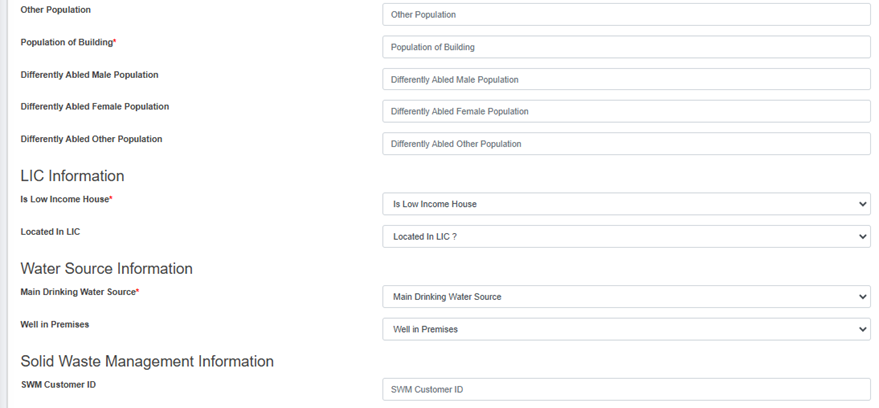
Figure 9- 3 Add Building Page
· After filling out the form, click Save and make sure a pop-up message is displayed, refer to section 7.1 Save for more details.
- If a mandatory form field is left out or any form failed validation during the form submission a validation message box will be prompted, refer to section 7.2 Validation Message Box for more details.
Overview:
The building add form is designed to collect and manage information about various attributes. It incorporates various skip logic that activates based on the information entered by the user. The details of the form fields are explained below:
Owner information
1. Owner Name - Full name of the building owner.
2. Owner NID – National Identity Card Number of the building owner.
3. Owner Gender - Gender of the building owner.
4. Owner Contact Number - Contact number of the building owner, it takes numeric values only.
Building Information
1. Main Building - Defines if the building is the main or auxiliary building. Select ‘Yes’ if it is a main building, and no if it is an auxiliary building. If ‘No’ is selected the Main Building House Number field is prompted.
· Main Building House Number - Unique identifier for the associated main building if building is auxiliary.
2. Ward Number - Identifier for the local administrative unit.
3. Road Code - Identifier for the road that the building is connected to. The dropdown menu for selecting the Road Code only displays the codes that are maintained in the Road Network sub-module of the Utility IMIS module.
4. House Number – Unique address code of the building.
5. House Locality / Address – Address of the building.
6. Tax Code / Holding ID - Identifier for the building’s tax record.
7. Structure Type - Type of the building structure.
8. Surveyed Date - Specific date on which the data collection was completed.
9. Construction Date - The date on which the building was constructed.
10. Number of Floors - Number of floors of the building, it allows only numeric values.
11. Functional Use of Building - The functional use of the building. When the subsequent Functional Use of Building is chosen, the Use Category of Buildings field is prompted which is also mandatory field to fill-up. The user can choose the use category with the following options:
|
Functional Use of Building |
Use Category of Buildings |
|
Residential |
Residential, Housing, Apartment, Orphanage, Old-aged Home, Hostel |
|
Mixed (Residential, Commercial, Office uses) |
Mixed |
|
Educational |
School, College, University, Training Center |
|
Health Institution |
Hospital, Clinic/ Health Post |
|
Commercial |
Shop, Restaurant, Hotel/ Resort, Offices (Private), Shopping mall/ Super Market, Party Palace/ Banquets, Business Complex |
|
Industrial |
Industry, Factory, Warehouse, Workshop, Printing Press |
|
Agriculture and Livestock |
Agriculture Farm, Livestocks |
|
Public Institution |
City hall, Museum, Public Library and archive, Public transportation terminal, Parking, Post office, Community Toilet, Public Toilet |
|
Government Institution
|
Municipal Office, Ward Office, Government Office, Police Office. Fire Station, Army barrack, Jail |
|
Recreational Institution |
Club, Stadium, Cinema/theatre, Sports complex, Fitness center, Recreational center |
|
Social Institution |
NGO, INGO, Political Party, Guthi house, Media, Social Group/ Samiti Bhawan |
|
Cultural and Religious |
Temple, Church, Mosque, Stupa, Hermitage (kuti), Mourning house, Bihar/Gumba, Bhajan Mandal, Cultural Centers |
|
Financial Institution |
Bank, Cooperative/ Finance |
|
Vacant/Under Construction |
Vacant building, Building under construction |
· If the user selects the options from the “Use Category of Building” that is either “Public Toilet” or “Community Toilet”, then the following fields are hidden from the add form:
§ Office or Business Name
§ Number of Households
§ Population of Building
§ Male Population
§ Female Population
§ Other Population
§ Differently Abled Male Population
§ Differently Abled Female Population
§ Differently Abled Other Population
1. Office or Business Name - Name of the business or office in the building, only prompted if the selected Functional Use is not “Residential”.
2. Number of Households - The total number of households served by the building.
3. Population of Building - Total number of individuals present within the building. This field is automatically calculated by summing the male, female and other population counts, but user can also enter the total population manually.
4. Male Population - Number of males living in a building
5. Female Population - Number of females living in a building.
6. Other Population - Number of individuals of other gender living in a building.
7. Differently Abled Male Population – Total number of differently abled males living in a building.
8. Differently Abled Female Population – Total number of differently abled females living in a building.
9. Differently Abled Other Population – Total number of differently abled individuals of other genders living in a building. The values for Differently abled male, female and other population value must not exceed the respective value of the male, female and other population fields.
10. Estimated Area (m2) – The approximate area calculated from the dimensions of the building polygon. It is not visible in the Add Building form but it is visible in the view details of the record, and is automatically calculated based on the size of the polygon that is submitted.
LIC Information
1. Is Low Income House – Indicate whether the household living in the building is a low -income household.
2. Located in LIC – Indicate whether the building is located in a low-income community area. If "Yes" is selected, the LIC Name field will be displayed.
3. LIC Name: Name of the LIC area if building is in LIC area. The dropdown menu for selecting the Road Code only displays the codes that are maintained in the Low Income Community sub-module of the Building IMS module.
Water Source Information
1. Main Drinking Water Source – Main source of drinking water supply to the building, if the user selects the option "Municipal/Public Water Supply," the water supply customer ID and water supply pipeline code will be displayed.
o Water Supply Customer ID - Unique identifier for the water supply customer record, if available.
o Water Supply Pipe Line Code - Code of the water supply pipe line that is connected with the building.
2. Well in Premises - Indication whether a well is present on the building premises.
o If ‘Yes’ is selected, Distance of Well from Closest Containment (m) : - Distance from the well to the nearest containment field is prompted.
o Distance of Well from Closest Containment (m) – Distance ‘in meters’ from the well to the nearest containment, if applicable.
Solid Waste Management Information
1. SWM Customer ID - Unique identifier for the solid waste management customer record, if available.
Sanitation System Information
1. Presence of Toilet - Identifies whether the building has a proper space for toilet facilities.
2. If “No” is selected, ‘Defecation Place’ field is prompted.
o Defecation Place - Indicates the designated area for an individual’s defecation.
o Open Defecation - Indicates the place for an individual’s defecation in an outdoor environment (fields, forests, bushes)
o Community Toilet – Indicates that the household uses a shared toilet that is built for the community
o If the option ‘Community Toilet’ is selected, the Community Toilet Name field is displayed.
i. Community Toilet Name – Name of the community toilet being used by the building’s residents.
3. If “Yes” is selected, following fields are prompted:
· Number of Toilets: Total number of toilets present in the building, the number of toilets value should be at least “1” and should always be a positive number.
· Households with Private Toilet - Number of households with private toilets.
· Population with Private Toilet: Total number of individuals that use private toilets.
· Toilet Connection: Connection of building’s sewage system.
Additional fields are prompted according to the options selected:
i. Onsite Treatment (eg., Anaerobic Digestor /Biogas, DEWATS)
ii. Composting Toilet (eg.; Ecosan, UDDT, etc.)
iii. Shared Septic Tank: If the option ‘Shared Septic Tank’ is selected BIN of pre - connected building field is displayed
iv. BIN of Pre – Connected Building: The BIN/House number of the pre-registered building that has the containment already connected with it. The dropdown menu only displays the codes that are maintained in the Buildings sub-module of the Building IMS module.
· Sewer Network - When the option ‘Septic Network’ is selected Sewer Code field is displayed.
i. Sewer Code: Code of the Sewer line that is connected to the building.
· “Septic Tank or Pit / Holding tank”- Upon the selection of the septic tank or pit/ holding tank, the form fields differ slightly from those of other sanitation systems due to the inclusion of containment information.
i. Building Accessible to Desludging vehicle - Indicates that the building's location can be easily accessed by a desludging vehicle
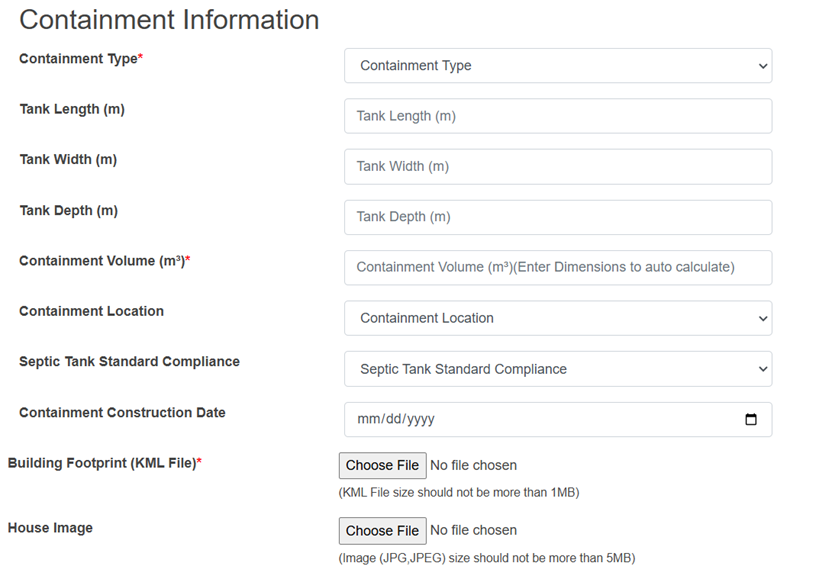
4. Containment Information (Only shows up when selected Sanitation System is either Septic Tank or Pit/ Holding Tank)
· Containment Type - Type of the containment that is used by the building.
i. By selecting either Septic Tank or Pit/ Holding Tank, the containment information is also different according to the type of containment.
ii. If the user selects the Sanitation System / Toilet Connection as “Septic Tank”, the tank related fields are displayed:
· Tank Length (m): Length of the containment.
· Tank Width (m): Width of the containment.
· Tank Depth (m): Depth of the containment.
iii. Additional field is displayed if the containment is related with the sewer connection. When the option “Septic Tank connected to Sewer Network” is selected “Sewer Code” field is displayed.
iv. If “Septic Tank connected to Drain Network” is selected “Drain Code” is displayed.
v. If the user selects the Sanitation System / Toilet Connection as “Pit/ Holding Tank” - different form fields are displayed:
· Based on the selection of the “Pit Shape”, corresponding dimensions for Tank Length, Tank Width, Tank Depth and Pit Diameter, Pit Depth fields are displayed:
· If Pit Shape “Cylindrical” is chosen Pit Diameter and Pit Depth is displayed.
a. Pit Diameter (m): Diameter of the pit.
b. Pit Depth (m): Depth of the pit.
· If Pit Shape “Rectangular” is chosen Tank Length, Tank Width and Tank Depth is displayed.
a. Tank Length (m): Length of the containment.
b. Tank Width (m): Width of the containment.
c. Tank Depth (m): Depth of the containment
· If ‘Lined Pit connected to Sewer Network ' is selected, “Sewer Code” field is displayed.
· If “Lined Pit connected to Drain Network” is selected “Drain Code” field is displayed.
· Drain Network – If “Drain Network” is selected Drain Code field is displayed.
i. Drain Code: Code of the Drain line that is connected to the building.
· Water Body – Waste from the toilet directly discharged into a water body (river or lake).
· Open Ground - Disposal of waste in an open field.
· Containment Volume (m3) - The volume of the containment, automatically generated according to tank length, width, depth or pit diameter, pit depth in cubic meter. The user is allowed to overwrite the auto calculated volume.
· Containment Location - Location of the Containment.
· Septic Tank Standard Compliance – Compliance standard of the Septic tank.
· Containment Construction Date - The date on which the containment was constructed.
Figure 9- 4 Containment Information
5. Building Footprint (KML File): Geospatial coordinates of the building (represented as a polygon) in KML file format. This will be pre-filled if the building is being added from the Building Survey Page as the building footprint has already been collected via mobile application.
6. House Image – Image of the building. If image is uploaded during the Add Building process, then that image will be displayed, if not image collected during the emptying process will be displayed. Additionally, if image is already present for the building, it will not be collected during the emptying process.
9.2.3 Add Containment to Building
When the user intends to make changes to the building details (edit), by clicking on edit button, user will be given an option to Add Containment to Building.
· The user will then be allowed to add new containment information to existing buildings.
· The form fields of the add containment are the same as the above-explained containment information in the form fields of the add building (refer to section 9.2.2 Add Building).
· The user can also edit the containment information from the building edit page by simply clicking the edit button, which redirects to the edit containment page.
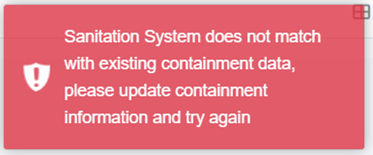
· If the user attempts to modify the sanitation system technology and the system encounters different containment information, the system will not allow the user to change the containment details directly. The user must update the appropriate containment information (delete containment connection, edit containment type), and then modify the sanitation system technology.
· When editing the building data, if a user attempts to delete the connection between the building and the containment, the following conditions must be met:
1. If the containment has application data with an "Emptying Status" of False, the connection to the building cannot be deleted.
2. If the application data is emptied, meaning the "Emptying Status" is True, the connection between the building and the containment can be deleted. In this case:
§ If the containment has a single connection to the building, it will be completely deleted.
§ If the containment has multiple connections (for example, a Septic Tank connected to both a Sewer Network and a Drain Network), only the connection to the building will be removed, and the Sewer Code or Drain Code for that containment will be nullified if the containment has outlet connections.
· Additionally, new containment information/ connection can also be carried out as per the requirements. Example: If the user initially has the sanitation system set to Sewer network and needs to add containment information, the user should click the 'Add Containment to Buildings' button, fill out the required fields, and click 'Save'. This will dynamically update the Sanitation System and add the containment information. The error message below is displayed if the user attempts to add a different containment to the existing one:
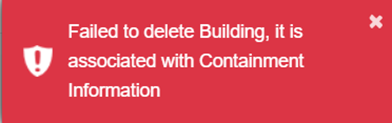
· For the deletion of either building or containment data, If the building has no connection with the containment, user can easily delete the building data, if it has the connection with the containment user must follow the below steps:
o Step1: To completely remove the building data, first user must remove the connection between the building and containment. This can be accomplished by clicking on the “View Containments Connected to Building” button. Upon selecting the details button, the user will be redirected to the containment details where user can proceed to delete the specific containment associated with the same building.
-
-
-
- Step 2: If the user attempts to delete building or containment data without removing the connection between the building and containment, the system will notify the user with an error message as:
-
-
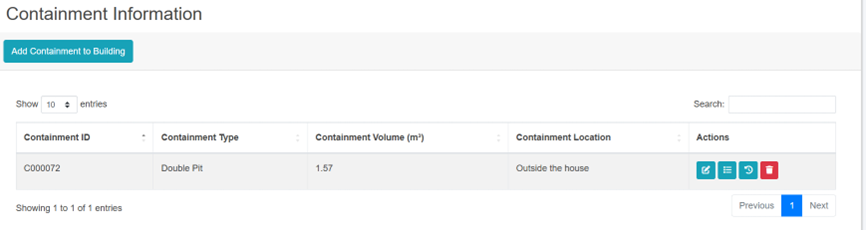
9.2.4 View containments connected to the Building
· Click on the Building button in the Action Column.

- A pop-up with containments connected to the building will be displayed.
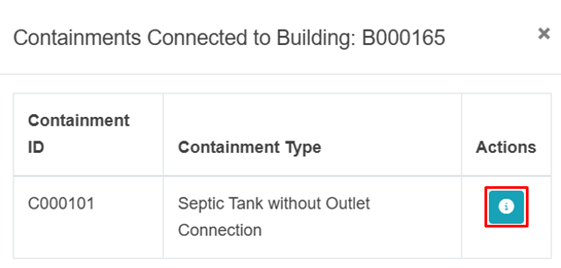
The user can click on the information icon (i) to view the details of the containment.
9.3 Building Survey
The Building Survey sub-module is dedicated to maintaining information about field surveys conducted to identify and digitize both pre-existing and new buildings in the municipality via the Building Information Collection mobile application. This application captures the building footprint and stores it in the Building Survey list. Users can add the building footprints stored in this module by approving the building and adding the necessary attribute fields as explained in the Add Building section (refer to section 9.2.2 Add Building). A separate detailed user manual is also available for the Building Information Collection Mobile App User Manual.
· Open the sidebar and click on the Building IMS to expand.
· Select Building Survey.
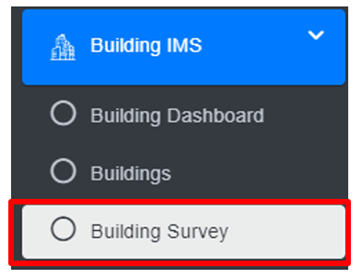
· This redirects to the Building Survey page.
· The user can see the list of building survey data collected through the mobile application
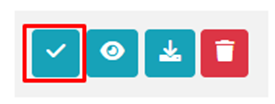
· User can add a new building by clicking on the Approve button in the action column (refer to section 9.3.2 Approve Building Structure).
- The user can preview the location of the Building (refer to section 9.3.3 Preview Building Location), download the building’s KML File (refer to section 9.3.4 Download Building KML File), delete the building record (refer section 6.3 Delete Record), and filter the data.
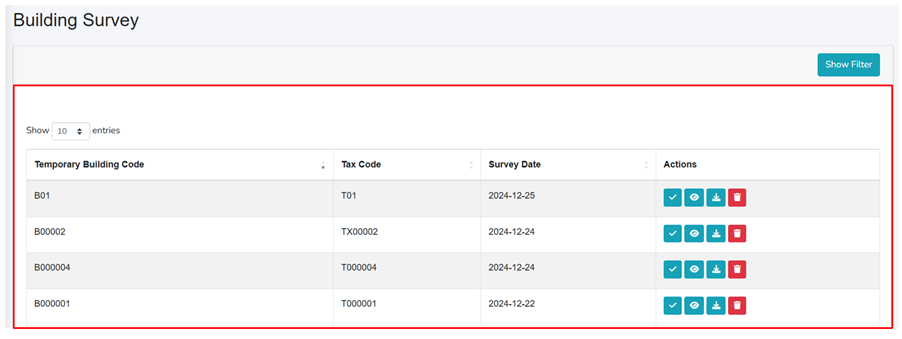
Figure 9- 5 Building survey lists
Refer to Building Information Collection Mobile App User Manual for detailed instructions for the building footprint survey/ collection process.
9.3.2 Approve Building Structure
· Click on Approve Building Structure in the Actions column.
- The Approve Building Structure form is displayed, and the fields are similar to Add Building (refer to section 9.2.2 Add Building), however, the Building Footprint (KML File) and the Surveyed Date are prefilled (refer to below Overview section)
- The following marked fields are pre-filled through the mobile application and then the detail information on the building.


Figure 9- 6 Approve Building
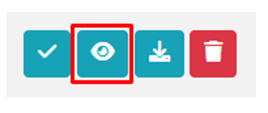
9.3.3 Preview Building Location
· Click on the Eye button in the Action Column
 .
.
- A Popup window as KML Viewer will appear that shows the location of a building under survey.
Overview:
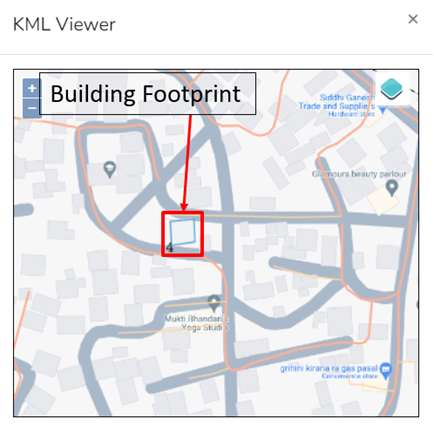
Figure 9- 7 Preview building location (KML viewer)
9.3.4 Download Building KML File
· Click on the Download button in the Action Column
Overview
· A KML file will be downloaded, and the user can check and verify the downloaded KML footprint whether it is valid or not via Google Earth/QGIS.
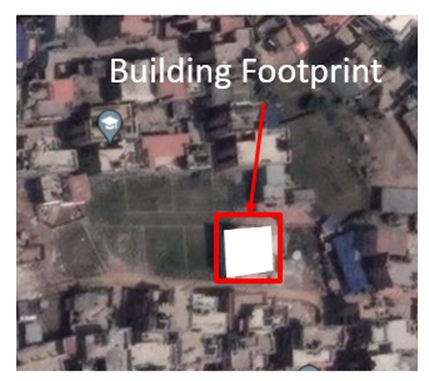
Figure 9- 8 Validating KML file in Google Earth
9.4 Low Income Community
The Low-Income Community sub-module is dedicated to maintaining information regarding the low-income communities in the city, along with the area they cover. This module enables the system to maintain individual buildings that are in LIC area along with their attribute information
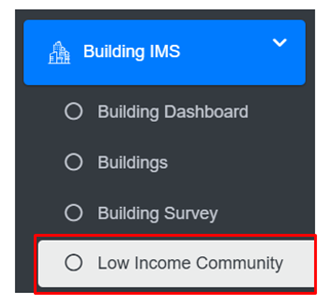
· Open the sidebar and click on the Building IMS to expand.
· Select Low Income Community.
Overview:
The Low Income Community Page lists all the attribute records of Low Income Communities stored in the module and provides different Filters, Actions, and Tools that can be used according to the requirements. For more details (refer to section 5 Filters, section 6 Actions and section 8 Tools).
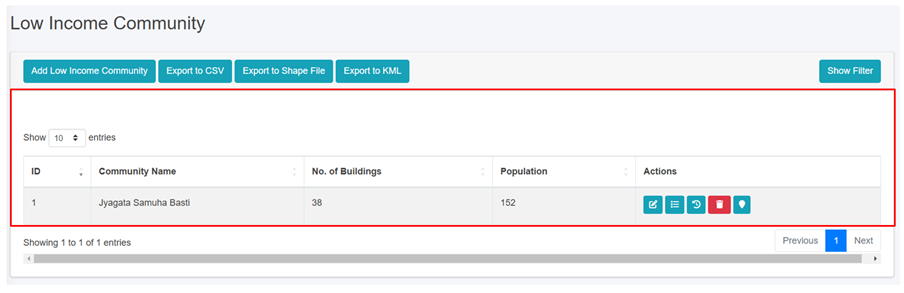
Figure 9- 9 : List of Low Income Community
9.4.2 Add Low Income Community
· Click on ‘Add Low Income Community’ button.
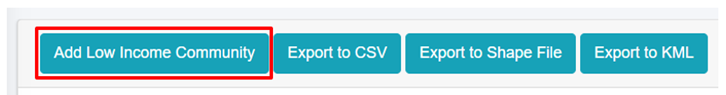
· User will be redirected to the following form:

Figure 9- 10: Add Low Income Community
· After filling out the form, click Save and make sure a pop-up message is displayed, refer to section 7.1 Save for more details.
- If a mandatory form field is left out or any form failed validation during the form submission a validation message box will be prompted, refer to section 7.2 Validation Message Box for more details.
Overview:
The Add Low-Income Community page consists of information that is explained below:
· Community Name: Name of the community.
· No. of Buildings: Total number of buildings in the community.
· Population: Total number of people in the community.
· No. of Households: Total number of occupied households within the community.
· Male Population: Total number of males living in the building.
· Female Population: Total number of females living in the building.
· Other Population: Total number of individuals of other genders living in the building.
· No. of Septic Tanks: Total number of septic tanks used by the buildings within the community.
· No. of Holding Tanks: Total number of Holding Tanks in the community.
· No. of Sewer Connections: Total number of connections to the municipal sewer system within the community.
· No. of Community Toilets: Total number of communal toilet facilities available in the community.
· Area: Choose the location where the low-income community is located and draw the corresponding area on the map.
o The top left corner displays the zoon-in and out button.
o The top right corner tab displays the Layers and Base maps.
Note:
- All fields takes only numeric value except “Community Name”.
- Deletion of Low Income Community data is not permitted when it is associated with building data.
Fecal Sludge Information Management System (FSIMS)
The FSIMS is another core and most important module CWIS. This module enables municipality to digitalize and manage all data related to sanitation systems and services. FSIMS digitalize the complete sanitation service chain from application request for emptying service to the safe disposal of faecal sludge at the treatment plant and the reuse of the treated waste.
Introduction to FSIMS
The FSIMS is categorized into five sub-modules:
i. FSM Dashboard (FSMD): The FSMD provides information related FSM services, overall, from containment emptying to transfer and disposal of waste in the FSTP. FSMD provides information about the number of containments; service providers; resources used for service delivery; applications received and responded; containments emptying status, volume of sludge collected, emptied and disposed; and the revenue generated,
ii. Containment Information Management System (CIMS): The CIMS maintains the information about the containments in the city, with their location information and attribute information such as building identification number (in case of multiple building served one containment, BIN of main building responsible for taking care of the containment), sanitation system type, dimensions, volume, last emptying date, next emptying date, etc. If a building is connected to a sewer network, that information is maintained in the building database. However, this module does not include a separate feature for adding new containments, if new containment must be added, it has to be updated in corresponding building in building database, through BIMS. A containment may be shared by multiple buildings or vice versa.
iii. Service Provider Information Management System (SPIMS): The SPIMS maintains the information related to the sanitation service providers registered with the city that provide emptying services within the city. This information is maintained by municipal authority whereas, two other functionalities employee information and desludging vehicles for service provider to maintain their information about their employees and the desludging vehicles. Only those service providers, employees and vehicles registered in this system are eligible to provide emptying, transporting and disposing faecal sludge in the FSTP or area designated by the municipality. This information helps municipality and service providers for efficient management of the resources and efficient service delivery. The information provided by SPIMS also helps monitoring KPIs set by municipality for service providers and tracking emptying vehicles to ensure that the waste emptied from the containment is transported and disposed in the area designated for disposing waste or FSTP allocated by the municipality.
iv. Treatment Plant Information Management System (TPIMS): The TPIMS maintains the information related to the treatment plants that could be FSTP, Centralized Wastewater Treatment Plant, Decentralized Wastewater Treatment Plant or Co-treatment Plant, those used by the city to dispose and treat collected faecal sludge or wastewater. In addition to this, this sub-module also maintains water sample test data with the standard parameters used for monitoring the performance of the treatment plants in the city.
The information maintained by TPIMS along the information maintained by BIMS and the ESIMS, helps municipal to monitor the CWIS indicators such as (i) FS treatment capacity as a % of total FS generated from non-sewered connections, (ii) FS treatment capacity as a % of volume disposed at the treatment plant, (iii) WW treatment capacity as a % of total WW generated from sewered connections and greywater and supernatant generated from non-sewered connections, and (iv) Effectiveness of FS treatment in meeting prescribed standards for effluent discharge.
v. Emptying Service Information Management System (ESIMS): The Emptying Service IMS digitalizes the sanitation service chain and enables the city to manage the entire sanitation service chain, starting from application requests for emptying service from the customer to the safe disposal of faecal sludge at the treatment plant. All the activities involved in this process can be monitored in real-time through ESIMS. The module is divided into four categories according to the different stages of the sanitation service chain i.e. application, emptying, sludge collection and feedback. The complete service chain is managed and maintained through the application section; however, the individual sections maintain further detailed information. There are several functional modules under this sub-module:
§ Application – this functional module is accessible to helpdesk and FSTP operator. The helpdesk uses it for receiving and maintaining application for customer’s emptying request and collecting and maintain feedback data. FSTP operators use it for updating sludge transferred from the emptied containment and disposed in the FSTP. There is a function to generate reports of emptying service under this functional module. Helpdesks generally are the part of the municipality’s sanitation department, emptier are part of the service providers and FSTP operators can be part of the municipality or the private operator as of municipality’s policy.
§ Emptying – there is an easy-to-use native mobile application (android) that allows collection of the emptying information while providing the emptying service, such that the information can be updated in real-time. The mobile application is used by emptier to collect the information such as emptying start and end time, number of trips, total cost for emptying, and the payment receipt number. Emptying details can be viewed in real-time by the help desk and other municipal staff who have access to this module.
§ Sludge collection – FSTP operator in FSTP updates the FS disposal record that includes date, time and volume of waste disposed in the FSTP through the functional module Application through the web app as the waste is transferred and disposed in FSTP. Help desk can view these records in real-time through this functional module.
§ Feedback – this functional module is accessible to the helpdesk, after completing sanitation service chain from emptying to disposal of the waste in the FSTP.
§ Help desks – this functional module is used to create help desk and update their information. Help desks generally are under municipality itself, but the system has the capability of managing multiple help desks.
Data maintained by FSIMS along with the building data and LIC data enables CWIS Information Management System to generate CWIS indicators such as (i) IHHL onsite sanitation system that have been desludged, (ii) Collected FS disposed at the treatment plant or designated disposal site, (iii) Low income onsite sanitation systems that have been desludged, (iv) FS collected from LIC that is disposed at treatment plant or designated area, (v) Educational institutions where FS generated is safely transported to TP or safely disposed in situ, (vi) Healthcare facilities where FS generated is safely transported to TP or safely disposed in situ, and (vii) Desludging services completed mechanically or semi-mechanically.
The data export tools under FSIMS allow users to export data in CSV, Shape and KML format where applicable.
10.1 FSM Dashboard
· Open the sidebar and click on Fecal Sludge IMS to expand.
· Select the FSM Dashboard.
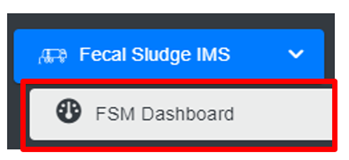
Overview:
· The FSM Dashboard provides a quick synopsis of the information maintained in this module. The bar charts and pie charts graphically represent various information related to the FSM sub-module.
· The user can interact with the chart’s tools (refer to section 6.8).
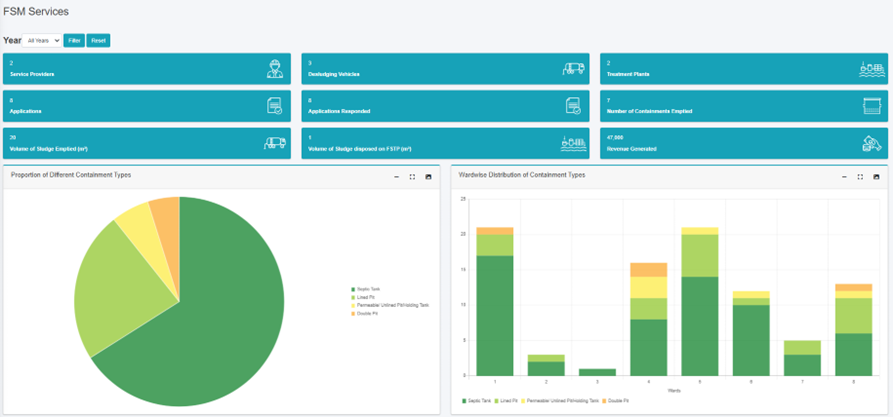
Figure 10- 1 FSM Dashboard
10.2 Containment IMS
The Containment IMS module stores information on containments, buildings connected to them, service history, and other associated data.
· Open the sidebar and click on Fecal Sludge IMS to expand.
· Click on Containment IMS and select Containments.
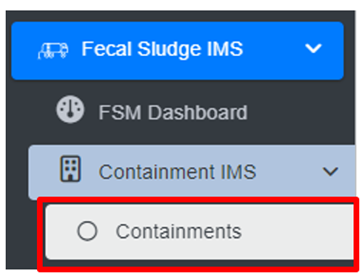
Overview:
The Containments Page lists all the attribute records stored in the module and provides different Tools, Actions, and Filters that can be used according to the requirements. For more details on Action buttons, review Section 6.
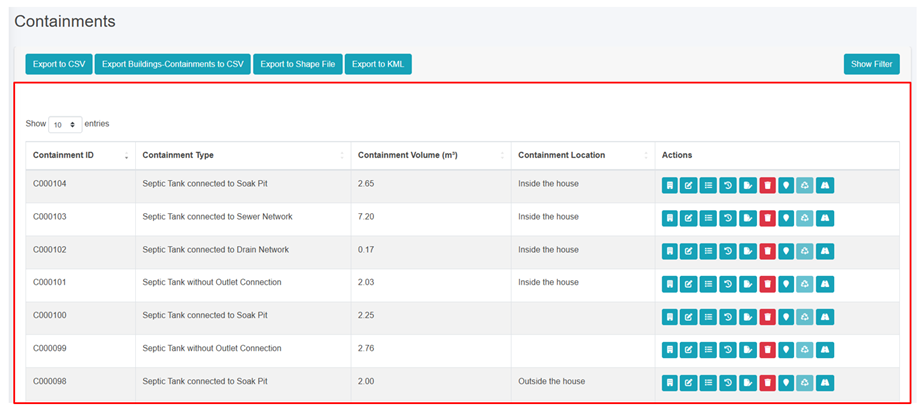
Figure 10- 2 List of Containment
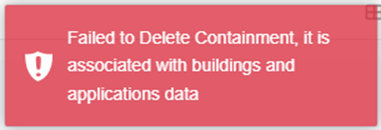
If the user wants to delete the containment data, the user must first remove the connection between the containment and the building then delete the containment accordingly.
10.2.2 View Building Connected to Containment
· Click on the View Building Connected to Containment which redirects to the building connected to the containment page.
· The Building Connected to Containment page will display the building information like BIN, Tax Code/ Holding ID, Structure Type, Estimated Area of the Building, and Functional Use of Building.
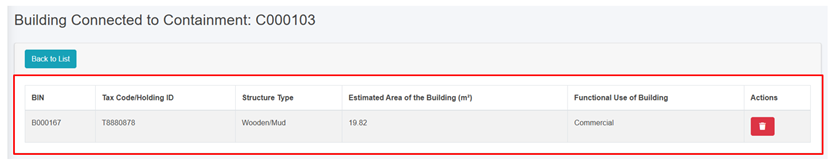
Figure 10- 3 List of Buildings Connected to Containment
Overview:
· By clicking the delete button, the user can disconnect the building from the connected containment but the containment information will remain.
· When user attempts to delete the containment data in which it has the application data then the following criteria must be met:
o If the containment has application data with an "Emptying Status" of False, the connection to the building cannot be deleted.
o If the application data is emptied, meaning the "Emptying Status" is True, the connection between the building and the containment can be deleted and the Sewer Code or Drain Code for that containment will be nullified if the containment has outlet connections.
10.2.3 Containment Type Change History
· Click on the Type Change History button in the Action column.
· This will redirect to the Type Change History page. This page contains detailed information on the changes that have been made to the Containment Type.
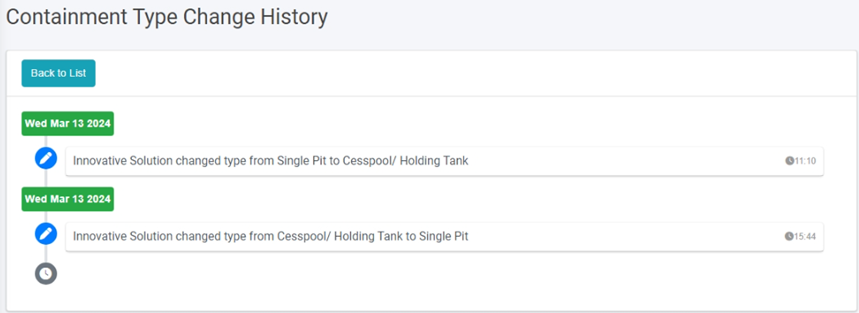
Figure 10- 4 Record of Type Change History
Overview:
· User can view the changes made to the record’s containment type, including the user who made the changes, the edited values and the date of the edits.
Click on Back to List to go back.
10.2.4 Emptying Service History
· Click on the Emptying Service History in the Action button to view the containment emptied history.
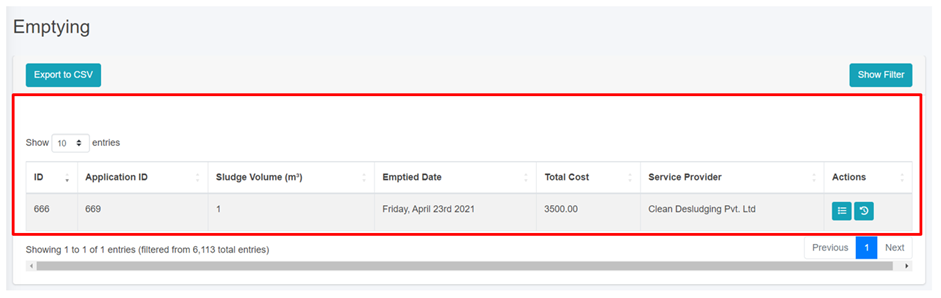
Figure 10- 5 List of Emptying
10.3.1 Service Providers
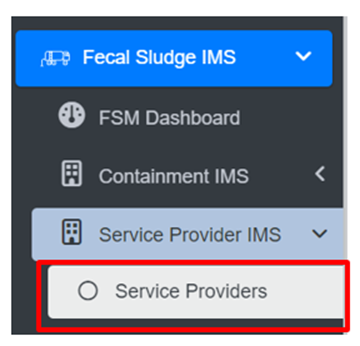
Overview:
· The Service Providers Page lists all the attribute records stored in the module and provides different Filters, Actions, and Tools that can be used according to the requirements. For more details (refer to section 5 Filters, section 6 Actions and section 8 Tools).
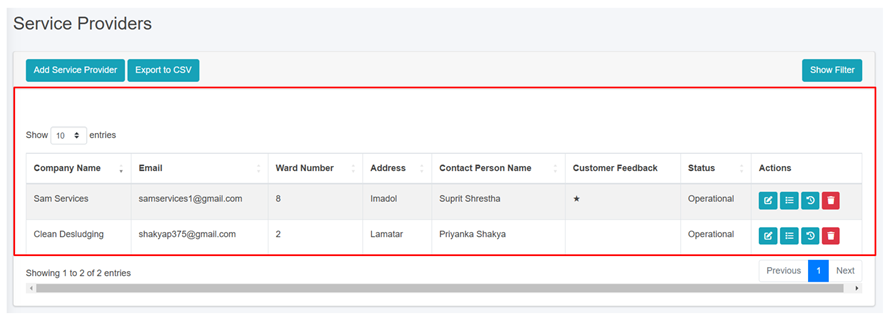
Figure 10- 6 list of Service Providers
b) Add Service Provider
· Click on the Add Service Provider button.
· This redirects to the Add Service Provider form page:
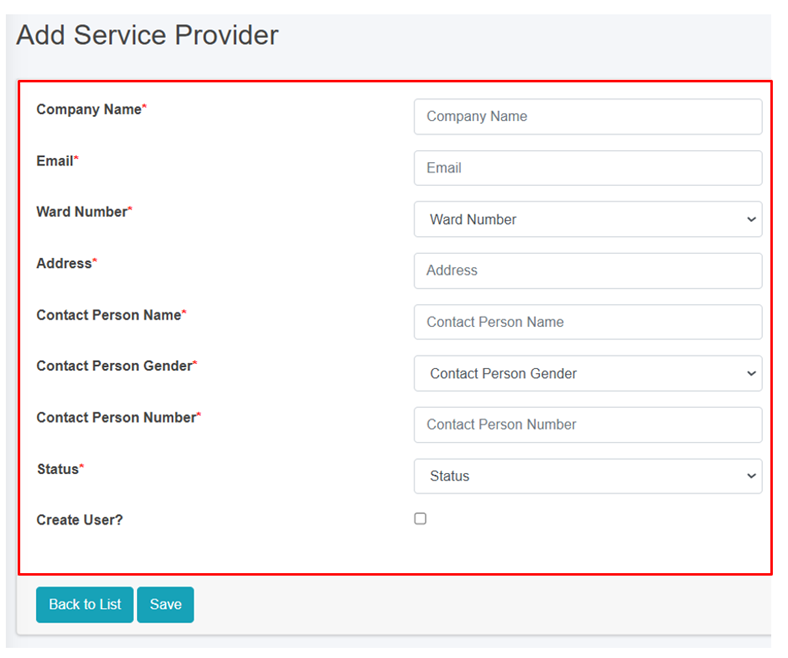
Figure 10- 7 Add new Service Provider
- After filling out the form, click Save and make sure a pop-up message is displayed, refer to section 7.1 Save for more details.
- If a mandatory form field is left out or any form failed validation during the form submission a validation message box will be prompted, refer to section 7.2 Validation Message Box for more details.
Overview:
The Add Service Provider page consists of information that are explained below:
· Company Name – Name of the Service Provider Company.
· Email – Email address of the service provider.
· Ward Number – The ward number where the service provider is located in.
· Address – Address of the service provider.
· Contact Person Name – Name of the company head/ proprietor/ contact person of the service provider.
· Contact Person Gender – Gender of the contact person.
· Contact Person Number – Contact number of the contact person/ service provider office.
· Status - Indicating the operational status of the service provider active or inactive. If the status is set as ‘Inactive’, then the service provider is disabled.
· Create User - If the user chooses to create a new user for the service provider (with Service Provider Admin role), then the user needs to check the Create User option and fill in the "Password" & "Confirm Password" fields, which will allow the user to log in. However, if a user doesn't select the "Create User" option, the password fields won't be visible, and the service provider user will not be created.
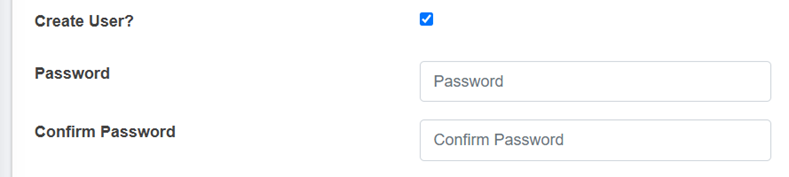
- Password: Password for the new service provider.
- Confirm Password: Confirm the password for the new service provider.
Note:
- The deletion of service provider data is not permitted, where its data is connected to any application, Desludging vehicles, Employee Information and the associated user. The user is only allowed to set to non-operational.
10.3.2 Employee Information
The Employee Information module maintains information related to the employees of the service providers.
• Open the sidebar and click on Fecal Sludge IMS to expand.
• Now, click on Service Provider IMS and select Employee Information.
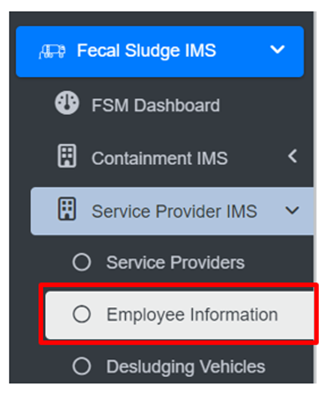
Overview:
The Employee Information Page lists all the attribute records stored in the module and provides different Filters, Actions, and Tools that can be used according to the requirements. For more details (refer to section 5 Filters, section 6 Actions and section 8 Tools).
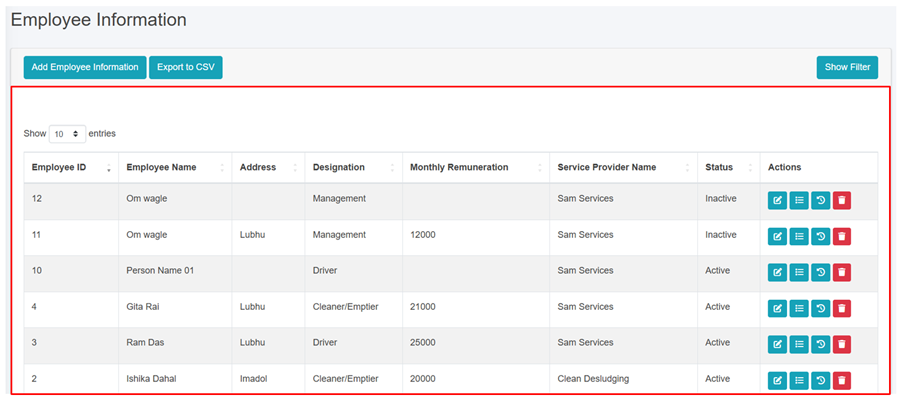
Figure 10- 8 List of Employee Information
b) Add Employee Information
· Click on the ‘Add Employee Information’ button.
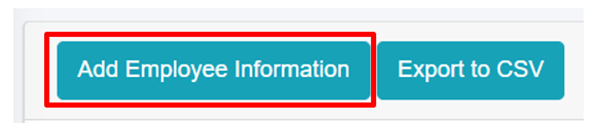
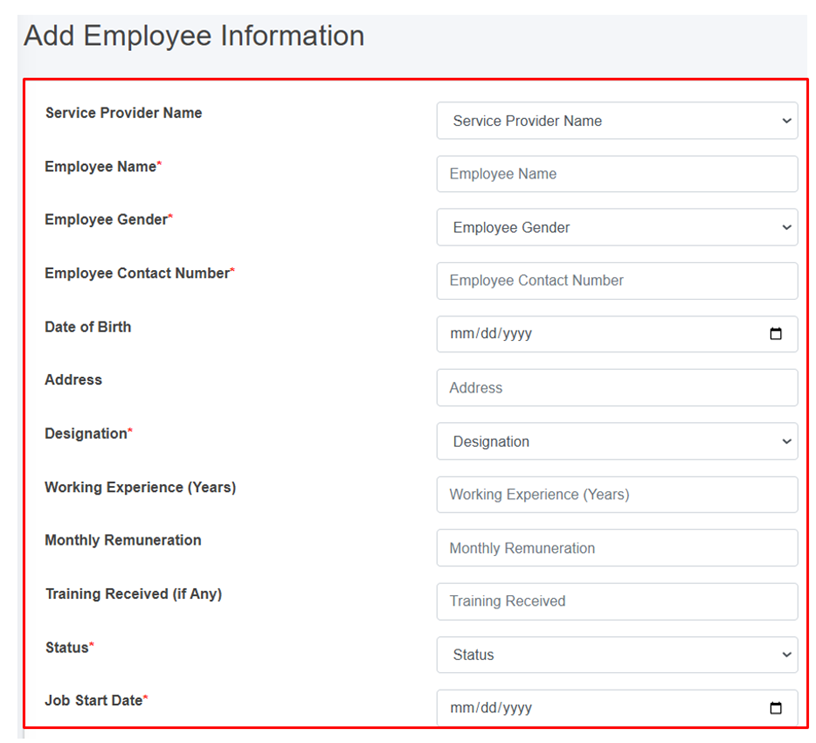
Figure 10- 9 Add Employee Information
- After filling out the form, click Save and make sure a pop-up message is displayed, refer to section 7.1 Save for more details.
- If a mandatory form field is left out or any form failed validation during the form submission a validation message box will be prompted, refer to section 7.2 Validation Message Box for more details.
Overview:
The add employee information form fields are explained below:
· Service Provider Name: Name of the service provider selected from list of pre-registered service providers. The dropdown menu for selecting the Service Provider name displays the names that are maintained in the Service Providers sub-module of the Service Provider IMS module. If the Service Provider’s Status is Non-operational in the Service Provider IMS module, they won’t be included in the list.
· Employee Name: Name of the employee.
· Employee Gender: Gender of the employee.
· Employee Contact Number - Contact Number of the employee.
· Date of Birth - Date of birth of the employee.
· Address - Address of the employee.
· Designation: Designation of employee.
o If the user selects “Driver” as the designation, two additional fields will be displayed.
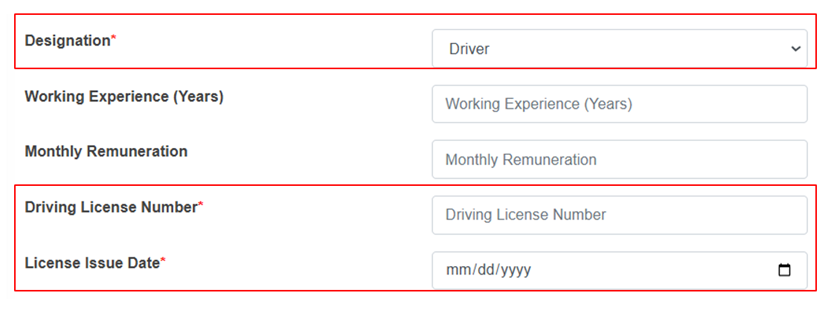
o Driving license Number – Unique identification number of the employee’s driving license.
o License Issue Date – The date on which the driving license was issued.
· Working Experience (Years) - Number of years of working experience of the employees.
· Monthly Remuneration - Monthly wage of the employee.
· Training Received (if Any) - Any trainings the employee has completed.
· Status: Indicates the operational status of the employee, active or inactive. If the status is set as ‘Inactive’, then the employee’s account is disabled.
· Job Start Date: Start date of the employee's employment.
Job End Date: End date of the employee's employment. (The Job End Date field is displayed if the status is inactive.)
Note:
- Deletion of employee information is not allowed if is associated with the ongoing emptying process.
10.3.3 Desludging Vehicles
A desludging vehicles sub-module maintains information related to a desludging vehicle also known as a sludge removal truck or a vacuum truck. It also maintains related information such as removing sludge and other waste materials from various sources.
· Open the sidebar and click on Fecal Sludge IMS to expand.
· Now, click on Service Provider IMS and select Desludging Vehicles.
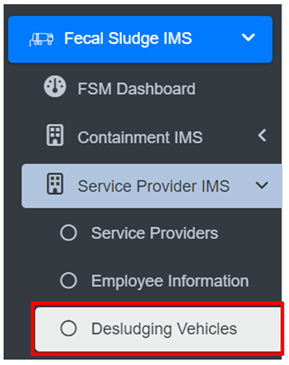
Overview:
The Desludging Vehicles Page lists the records stored in the module and provides different Filters, Actions, and Tools that can be used according to the requirements. For more details (refer to section 5 Filters, section 6 Actions and section 8 Tools).
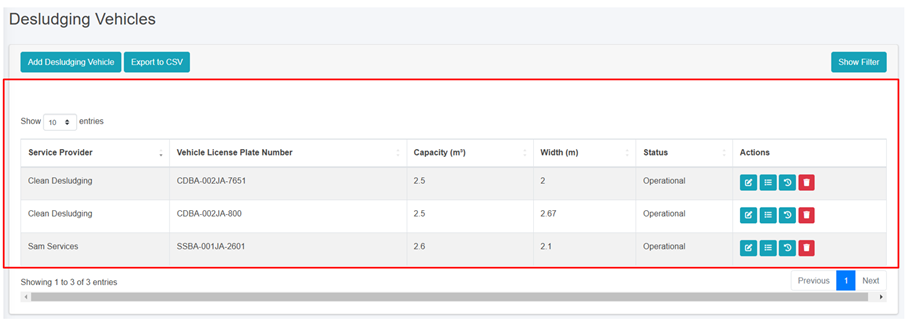
Figure 10- 10 List of Desludging Vehicles
b) Add Desludging Vehicle
· Click on “Add Desludging Vehicle” button.
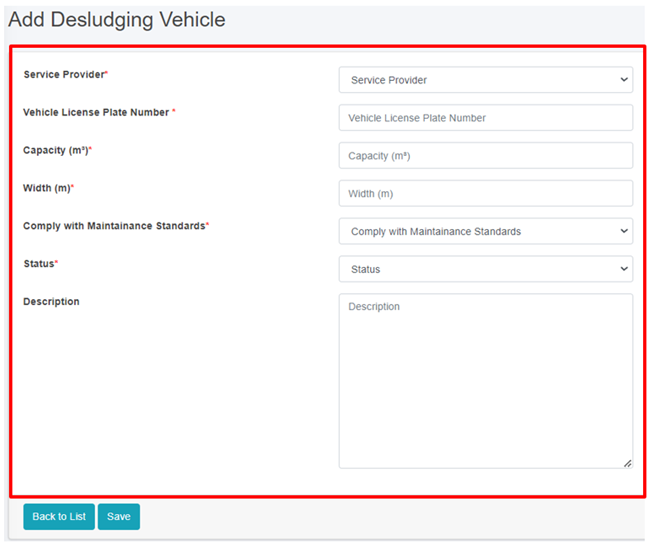
Figure 10- 10 Add Desludging Vehicle
• After filling out the form, click Save and make sure a pop-up message is displayed, refer to section 7.1 Save for more details.
• If a mandatory form field is left out or any form failed validation during the form submission a validation message box will be prompted, refer to section 7.2 Validation Message Box for more details.
Overview:
The Add Desludging Vehicle page consists of information that are explained below:
• Service Provider - Name of the operational service provider selected from the list of pre-registered service providers.
• Vehicle License Plate Number - The license plate number of the desludging vehicle.
• Capacity (m3) - The capacity of the desludging vehicle in cubic meters.
• Width (m) - The width of the desludging vehicle in meters.
• Comply with Maintenance Standards: Ensuring that the vehicles are regularly inspected, serviced, and repaired as needed to maintain their operational efficiency, safety, and compliance with regulatory requirements.
• Status - Indicating the operational status of the Desludging Vehicles. If the status is set as non-operational, then the desludging vehicles is disabled.
• Description- A description of the desludging vehicle.
Note:
• If the desludging vehicles is present in any of the emptying, then the deletion is not allowed, only the user is permitted to set its data to non-operational.
10.4 Treatment Plant IMS
10.4.1 Treatment Plants
Treatment Plants sub-module of Fecal Sludge IMS maintains information of different treatment plants that either treats wastewater collected and conveyed by sewer network or fecal sludge which are emptied and transported from containments mechanically.
· Open the sidebar and click on Fecal Sludge IMS to expand.
· Now, click on Treatment Plant IMS and select Treatment Plants.
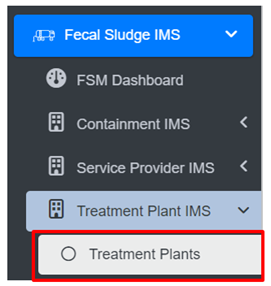
Overview:
The Treatment Plants page lists the records stored in the module and provide different Filters, Actions and Tools that can be used according to the requirements. For more details (refer to section 5 Filters, section 6 Actions and section 8 Tools).
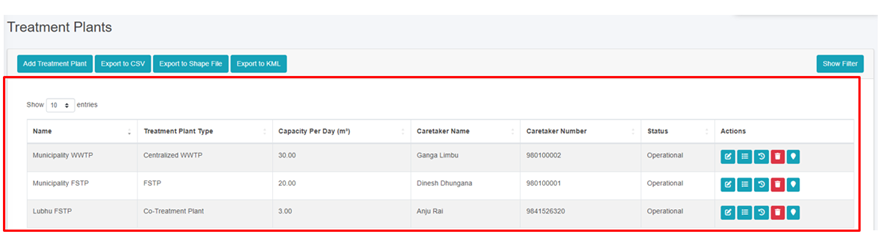
Figure 10- 11 List of Treatment Plant
b) Add Treatment Plant
· Click on ‘Add Treatment Plant’ button.
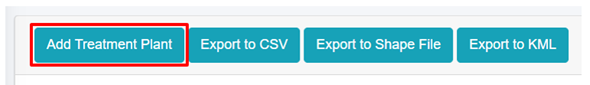
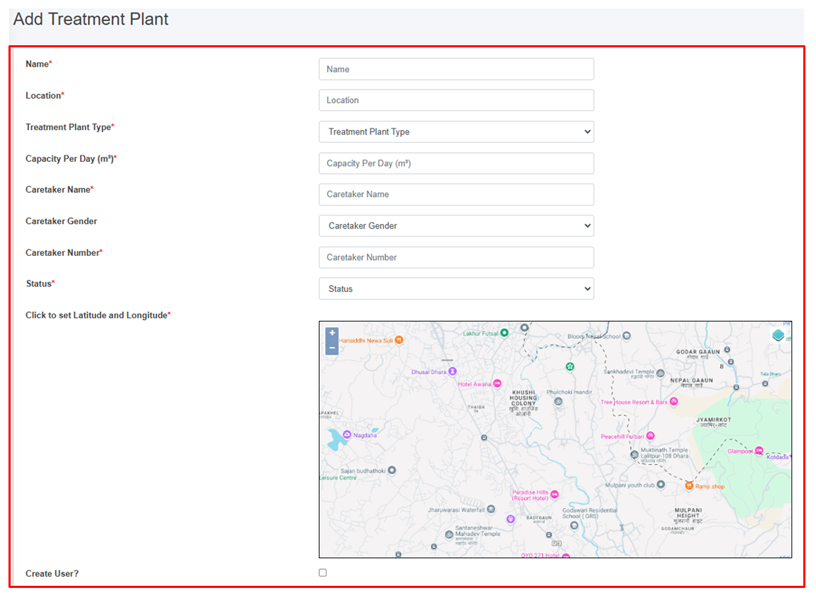
Figure 10- 12 Add Treatment Plant
- After filling out the form, click Save and make sure a pop-up message is displayed, refer to section 7.1 Save for more details.
- If a mandatory form field is left out or any form failed validation during the form submission a validation message box will be prompted, refer to section 7.2 Validation Message Box for more details.
Overview:
The add new treatment plants page consists of different form fields that capture different information which are explained below:
· Name - Name of the treatment plant.
· Location- Location of the treatment plant where it is situated.
· Capacity per Day (m3) - Total capacity per day of the treatment plant to treat sludge. (it takes numeric value only)
· Treatment Plant Type - The type of the treatment plant designed to treat either wastewater or fecal sludge.
o FSTP – Fecal sludge treatment plant.
o Centralized WWTP - Centralized waste water treatment plant.
o Decentralized WWTP – Decentralized waste water treatment plant.
o Co- Treatment Plant - Treatment plants where wastewater and fecal sludge are treated together by the sanitation expert.
· Caretaker Name - Name of the caretaker of the treatment plant.
· Caretaker Gender – Gender of the Caretaker.
· Caretaker Number - Contact number of the Caretaker (It takes numeric values only).
· Status - Status of the treatment plant that is operational or non-operational.
· Click to set Latitude and Longitude - Find the treatment plant location on the map and pin a marker on the map by clicking on that location. This will mark the spatial location of the treatment plant in the map with latitude and longitude.
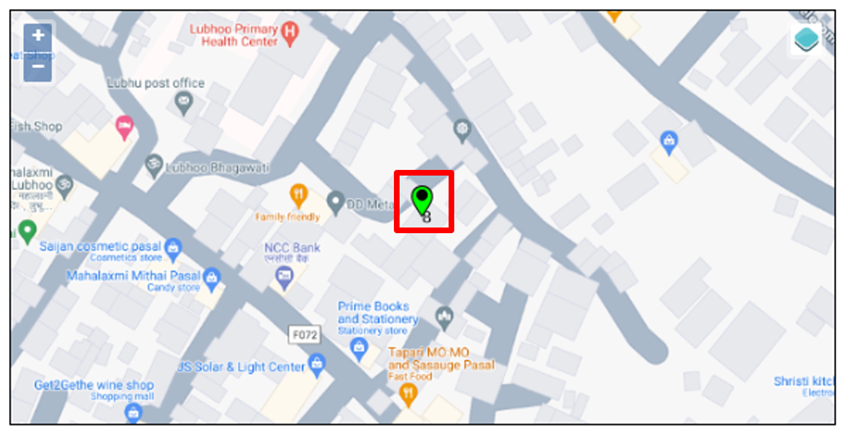
Figure 10- 13 Pinned Location of new treatment plant
· Create user? - If the user chooses to create a new user for the Treatment plant (with Treatment Plant Admin role), then the user needs to check the Create User option and fill in the "Password" & "Confirm Password" fields, which will allow the user to log in.
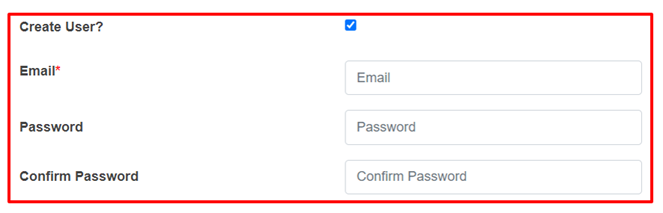
Figure 10 - 14 Create new user
· Email- Email of the user to log into the system.
· Password- Password of the user to log into the system (The password must contain one uppercase, one lowercase and must contain at least one symbol)
- Confirm Password: Enter the exact entered password again.
Note:
Deletion of treatment plant data is not allowed if any of the following conditions are met:
· The treatment plant has associated emptying records, only the its status can be set to non-operational.
· The treatment plant has associated performance efficiency test records.
· The treatment plant has associated users.
When the deletion is allowed, the associated sewers or drains linked to the Treatment Plant ID are nullified.
10.5 Performance Efficiency Standards
The Performance Efficiency Standards Sub-module basically set the parameters of standards for the module that is Performance Efficiency Test at the start when interacted with the web-application
• Open the sidebar and click on Fecal Sludge IMS to expand.
• Now, click on Treatment Plant IMS and select Performance Efficiency Standards.

Overview:
The Performance Efficiency Standards Page displays the overall parameters maintained by the sub-module.
· The user can Edit the Performance Efficiency Standard, click on the Edit button

Figure 10- 16 Edit Performance Efficiency Standard Page
- After Editing is completed, click Save and make sure a message is displayed, refer to section 7.1 Save for more details.
The fields that are displayed while editing the form are mentioned below:
· TSS Standard (mg/I) - Total suspended solids (TSS) Standard Value (mg/l).
· ECOLI Standard (CFU/100 mL) - ECOLI Standard (CFU/100 mL).
· pH Minimum - Minimum pH value.
· pH Maximum - Maximum pH value.
· BOD Standard (mg/l) - Biochemical oxygen demand (BOD) standard (mg/l).
Note:
- The Above mentioned fields only takes the numeric values.
10.5.2 Performance Efficiency Test
Performance Efficiency Test sub-module involves a comprehensive evaluation of the treatment plant’s operational effectiveness on removal of pollutants either from wastewater or fecal sludge.
· Open the sidebar and click on the ‘Fecal Sludge IMS’.
· Now, click on ‘Treatment Plant IMS’ and select ‘Performance Efficiency Test’.
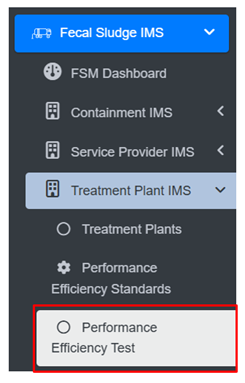
Overview:
· The user can see the lists of the performance efficiency test conducted on wastewater or fecal sludge treatment plants and provides different Filter, Actions and Tools that can be used according to the requirements. For more details (refer to section 5 Filters, section 6 Actions and section 8 Tools).
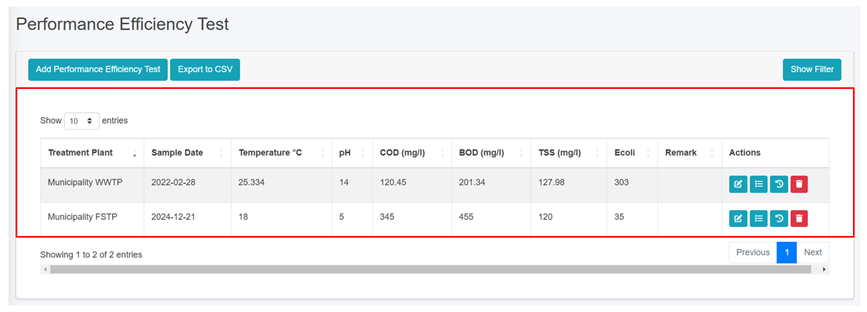
Figure 10 - 17 List of Performance Efficiency Test
b) Add Performance Efficiency Test
· Click on ‘Add Performance Efficiency Test’ button.
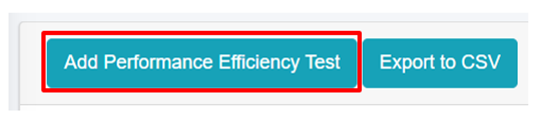
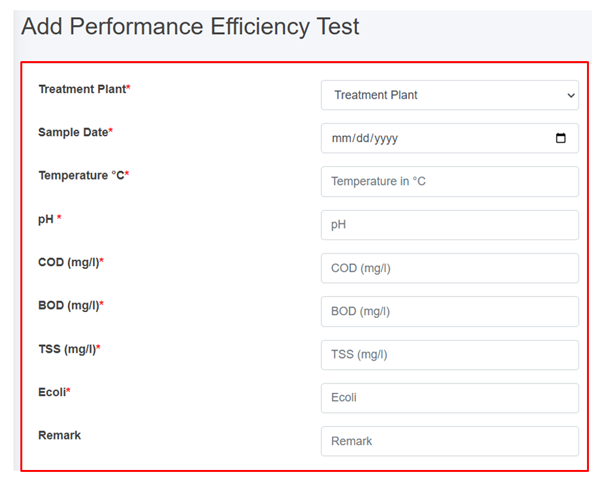
Figure 10- 18 Add performance Efficiency Test
· After filling out the form, click Save and make sure a pop-up message is displayed, refer to section 7.1 Save for more details.
- If a mandatory form field is left out or any form failed validation during the form submission a validation message box will be prompted, refer to section 7.2 Validation Message Box for more details.
Overview:
The fields of the performance efficiency test form are explained below:
· Treatment Plant- Name of the treatment plant for which the test has been carried out.
· Sample Date- The date on which the test is conducted (It must be before or equal to the current date).
· Temperature °C- Temperature of the wastewater sample at the time of testing (It takes numeric values only).
· pH- The pH value of the sample. It reveals the acidity or basicity of the wastewater sample, expressed on a scale ranging from 0 (highly acidic) to 14 (highly basic), it takes numeric values only ranging between 0-14.
· COD (mg/l)- The Chemical Oxygen Demand (COD) value of the sample. Chemical oxygen demand indicates the amount of oxygen required to break down organic matter in the wastewater (It takes numeric values only).
· BOD (mg/l)- The Biochemical Oxygen Demand (BOD) value of the sample. Biochemical oxygen demand indicates the amount of oxygen consumed by microorganisms as they decompose organic matter in the wastewater (It takes numeric values only).
· TSS (mg/l)- The Total Suspended Solids (TSS) value of the sample. Total Suspended Solids indicates the amount of solid material suspended in the wastewater sample (It takes numeric values only).
· Ecoli- Number of Ecoli present in the sample (It takes numeric values only).
- Remark- Additional notes or observations about the performance efficiency test.
10.6 Emptying Service IMS
Emptying Service IMS includes the sub-modules which allows the management and monitoring of the sanitation value chain. This sub-module includes Applications, Emptying, Sludge Collection, Feedback, and Help Desk, which are the primary components of the sanitation value chain.
10.6.1 Application
The Application sub-module is responsible for managing information related to submitted Emptying Service Applications. It stores data of applications received through the help desk that require emptying, and applications that have already been serviced. The Applications page serves as a central hub for all service delivery processes, as it contains all components of the service delivery chain.
On the Applications page, user can access the status of an application through four different Stages: Application, Emptying Status, Sludge Collection Status and Feedback Status. By clicking on the corresponding button next to the check mark, user can view the emptying information or sludge collection or feedback related to a particular application. User can edit the emptying details, sludge collection details and feedback details at certain stages of the application process.
· Open the sidebar and click on Fecal Sludge IMS to expand.
· Now, click on the Emptying Service IMS and select Application.
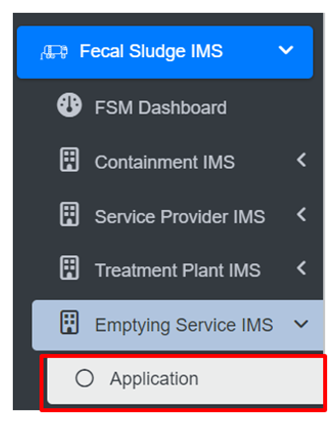
• On the application page, the data such as Employee information, Desludging vehicle, and Emptying Service IMS are only visible according to the assignment of the service provider and its disposal place, where service provider1 can only view the details related to the service provider1. This page provides different Filter, Actions and Tools that can be used according to the requirements. For more details (refer to section 5 Filters, section 6 Actions , section 8 Tools and section 10.2.4 Emptying Service History).
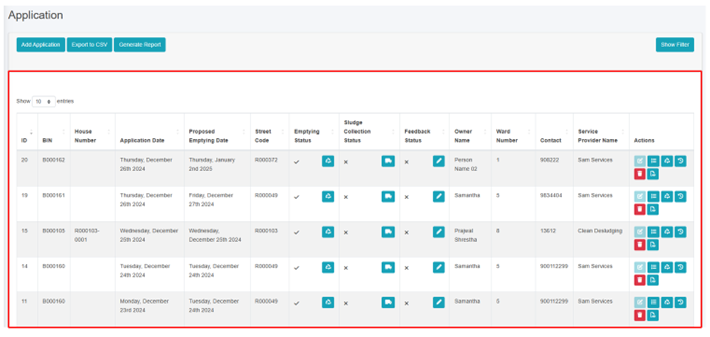
Figure 10- 19 List of Application
b) Generate Report
Generate Report tool produces the report in a PDF format monthly. Here the reports consist of different information such as: Operator name from where the containments are emptied, number of containments that is cleaned, total volume of sludge collected, number of applications who received the service and the total cost that is incurred during the sludge collection process. It also consists of ward wise cumulative data that of selected month displaying the ward no, containments emptied, application received, sludge collection and total cost.
· Click on ‘Generate Report’.
· Select the month and year field from dropdown.
· Click on ‘Export to PDF’ button to get the data based on the desired selections.
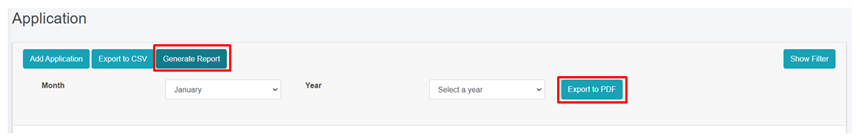
Figure 10- 20 Generate Report
Overview:
- User can download a report in PDF format, as shown below:
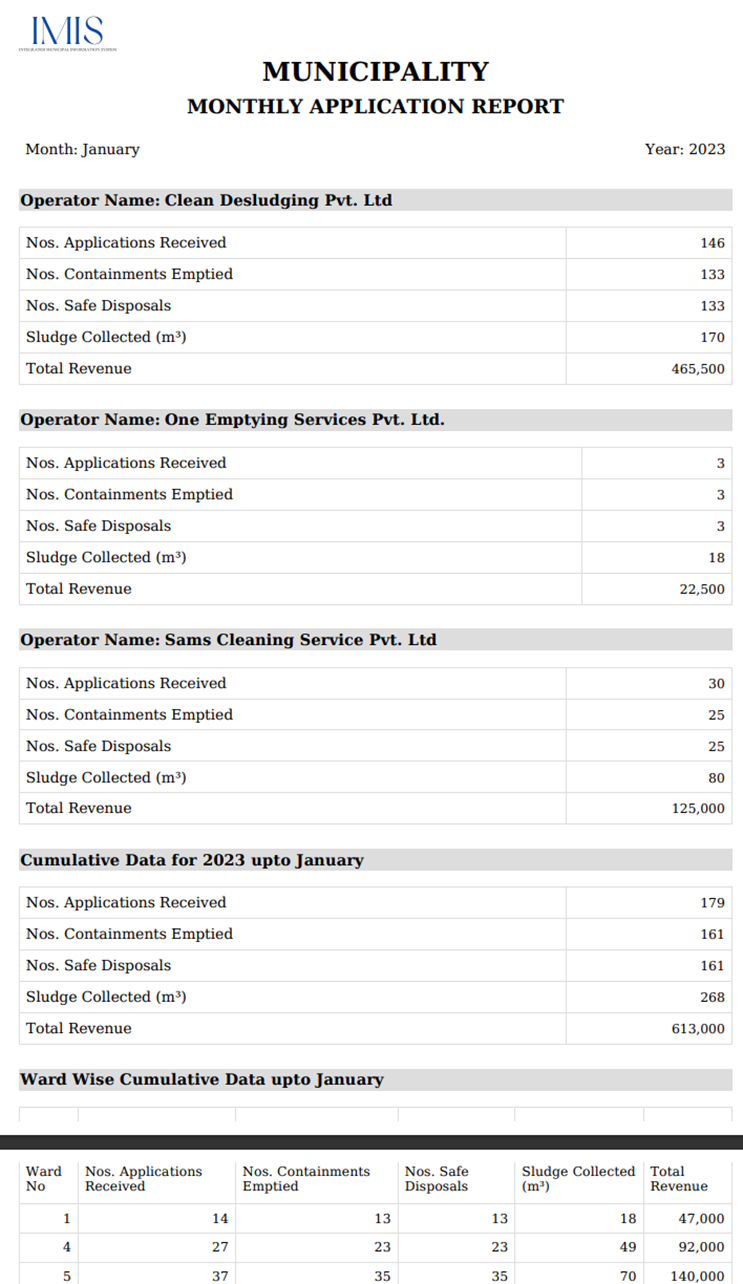
Figure 10- 21 Overview of Generated Report
c) Add Application
· Click on the ‘Add Application’ button.
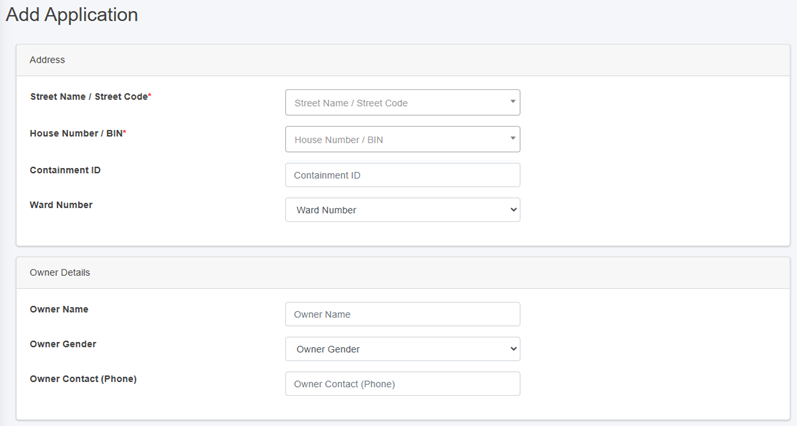
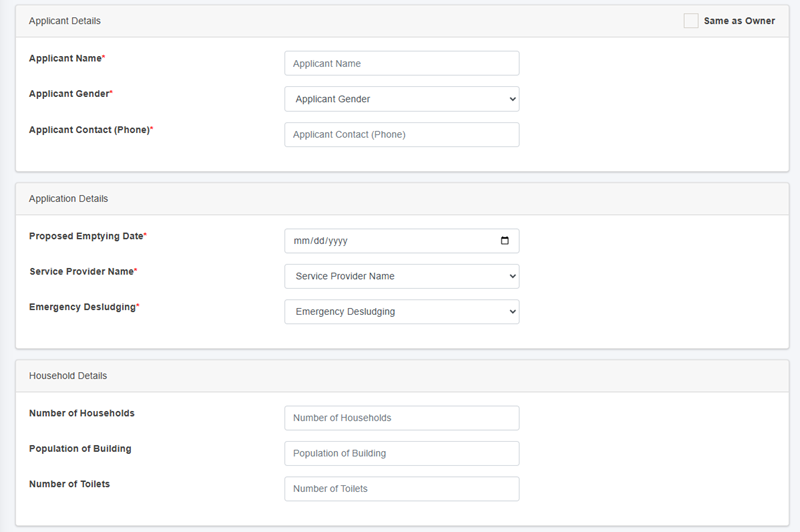
Figure 10- 22 Add Application Form
• After filling out the form, click Save and make sure a pop-up message is displayed, refer to section 7.1 for more details.
• If a mandatory form field is left out or any form failed validation during the form submission a validation message box will be prompted, refer to section 7.2 Validation Message Box for more details.
Overview:
The form fields of the application are explained below:
Address
· Street Name - Identifier for the road the building is connected to. The unique identifier of the building where the containment is located. User can also search for the street code or name using the street name or its code.
· House Number / BIN - The unique identifier of the building where the septic tank is located. Additionally, user can perform searches for the containment id using the house number or BIN.
· Containment ID - The selected House Number / BIN containment ID is displayed here. This field is read-only if only one containment is connected to the building. If there is more than one, a dropdown menu listing the containments connected to the building will appear. If the user selects a containment that is currently active, the application cannot be created until the active containment has been emptied.
· Ward Number - Identifier for the local administrative unit the building/ containment is located.
Owner Details
When House Number / Bin is selected, the owner details are automatically filled and cannot be edited.
· Owner Name - Name of the owner of the building where emptying service is required.
· Owner Gender - The gender of the owner.
· Owner Contact (Phone) - The contact number of the owner, it takes numeric values only.
Applicant Details
· If the applicant is the same as the house owner, select Same as Owner “Checkbox” which will auto-fill the owner’s details as the application details as well, indicating that the applicant is the house owner.
· Applicant Name - The name of the applicant who lodged the application for the emptying service, can be the same as owner.
· Applicant Gender - The gender of the applicant.
· Applicant Contact (Phone) - The contact number of the applicant, takes numeric values only.
· Proposed Emptying Date - The date when the septic tank is proposed to be emptied, only a future date is allowed to be selected.
· Service Provider Name - Identifier for the service provider assigned to provide the emptying service.
· Emergency Desludging - Indicating whether the desludging has a high priority.
Households Details
When the user selects the House Number / Bin, the Household Details section is automatically filled. These fields cannot be edited once the form is submitted, as outlined below:
o Number of Households – The total number of households served.
o Population of Building – The number of population served.
-
-
-
- Number of Toilets – The total number of toilets.
-
-
d) Actions
i. Add Emptying Service Details
• Click on the ‘Add Emptying Service Details’ button.

• This redirects to the Add Emptying Service Details page.
Overview:
· Emptying Information is collected from the mobile app which is the updated in the web application in the application sub-module. This information can also be collected through the web application interface as well, but the use of the mobile application is recommended.
· Refer to the Emptying Information Collection Mobile App User Manual for collecting the emptying information.
· The application must process through each stage in a serial manner. First, only the emptying service details form is enabled, leaving the other two form that is sludge collection status and feedback status disabled. When the user fill in the first form (Emptying details) and submit it, only then the second-page sludge collection status page is enabled and the for the third form page, when the user fill the second form it will be enabled.
· The Edit form/ view details page is prompted only after emptying details are filled and once the application is completed to the final stage the edit button will be disabled.
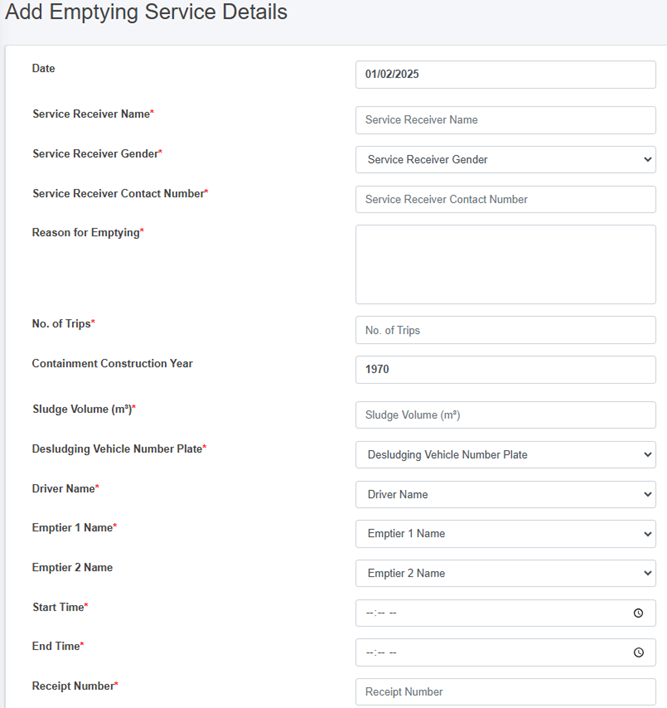
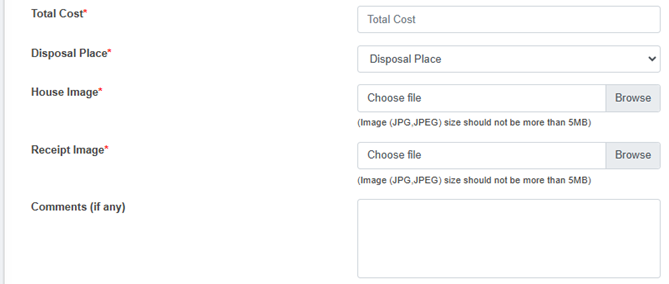
Figure 10- 23 Add Emptying Service Details Form
• After filling out the form, click Save and make sure a pop-up message is displayed, refer to section 7.1 Save for more details.
• If a mandatory form field is left out or any form failed validation during the form submission a validation message box will be prompted, refer to section 7.2 Validation Message Box for more details.
Overview:
The emptying service details can be obtained from mobile as well as from the web. The form fields from the web are explained below:
· Date - The date is auto-filled.
· Service Receiver Name - Name of the person present at the time of emptying.
· Service Receiver Gender - Gender of the person present at the time of emptying.
· Service Receiver Contact Number - Contact Number of the person present at the time of emptying (This field only allows the numeric values).
· Reason for Emptying - The reason for emptying the containment.
· No. of Trips – The number of the trips require to complete the emptying process. (Its value should be at least “1”)
· Containment Construction Year - The year the containment was constructed; this field is auto-filled.
· Sludge Volume(m3) - The volume of sludge (m3) that has been emptied from the containment. (the volume of sludge to be emptied must be less than the containment size)
· Desludging Vehicle Number Plate - The number plate of the desludging vehicle used for emptying. The user must select a vehicle number plate from the list of operational vehicles registered under the chosen service provider.
· Disposal Place - Name of the Treatment Plant where collected sludge will be disposed.
· Driver Name - Name of the desludging vehicle operator of the assigned service provider.
· Emptier 1 Name - Name of the cleaner/emptier employee.
· Emptier 2 Name - Name of the cleaner/emptier employee
· Start time - The start time of the emptying process.
· End Time - The end time of the emptying process (The End time must be after the Start time)
· Receipt Number - Receipt number that is generated after the emptying process is completed.
· Total Cost - The total cost of the emptying process (This field only allows numeric values).
· House Image - Image of the building from where the sludge was emptied.
· Receipt Image - Image of the receipt generated after the emptying process.
· Comments (if any) - Comments from operation, if any.
Note:
- For House and Receipt Image - The user can select the image to fill the field (The image type should be JPEG or JPG with size of less than 5 MB).
- If the house image is uploaded during the add building process, it will not be displayed. However, if it not uploaded, the field will be displayed.
ii. Add Sludge Collection Details
· Click on the ‘Sludge Collection Details’ button.

• This redirects to the Add Sludge Collection page
· The Sludge Collection button is only enabled after the emptying details is filled.
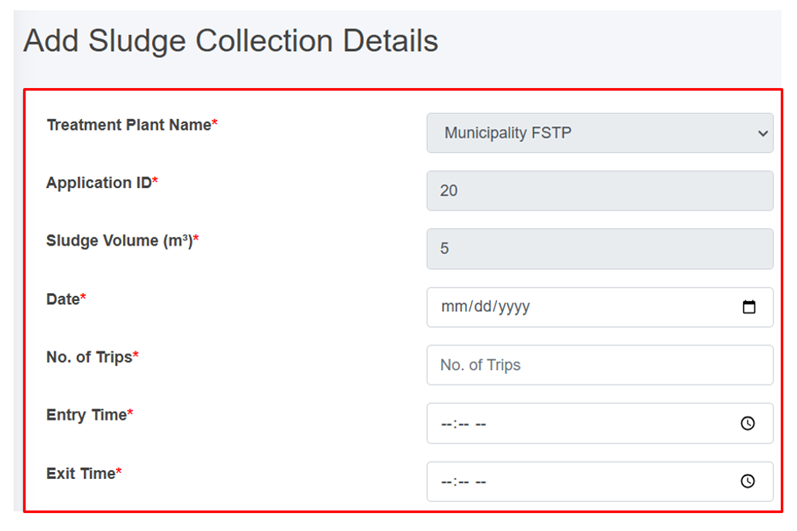
Figure 10- 24 Add Sludge Collection Details Form
- After filling out the form, click Save and make sure a pop-up message is displayed, refer to section 7.1 Save for more details.
- If a mandatory form field is left out or any form failed validation during the form submission a validation message box will be prompted, refer to section 7.2 Validation Message Box for more details.
Overview:
The Sludge Collection details form fields are explained below:
· Treatment plant - Name of the treatment plant where the sludge will be disposed (This field is auto-filled.
· Application ID - A unique identifier for the application submitted by the customer. (This field is auto-filed)
· Sludge Volume (m³) - Volume of sludge (m3) disposed. (This field is auto-filled)
· Date: Date of the sludge disposal (Selected date cannot be before the present date).
· No. of Trips – The number of trips require to complete the sludge collection. (Its value must at least “1”)
· Entry Time - Entry time of a vehicle to FSTP from the sludge collection.
- Exit Time - Exit time of a vehicle to FSTP from the sludge collection site (The exit time should be after the Entry Time).
iii. Add Feedback Details
· Click on the ‘Feedback details’ button.

- This redirects to the Feedback Details page.
- The feedback button is only enabled after filling the emptying service details. Once the user submits the feedback, it can only be view.
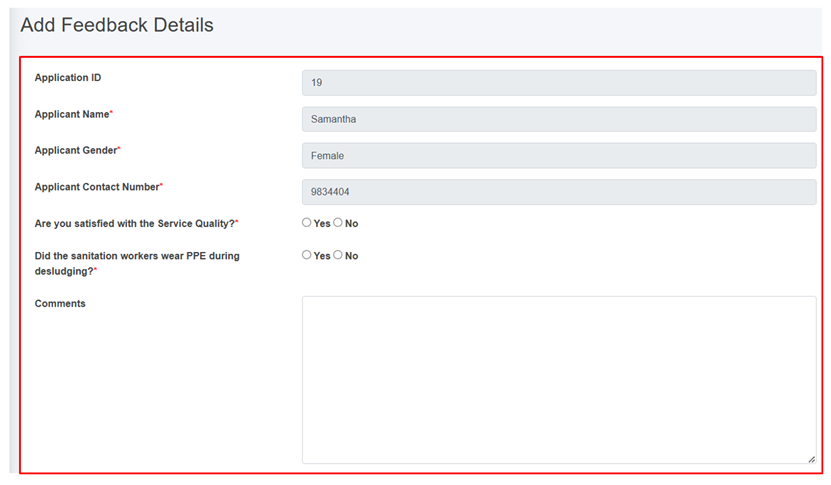
Figure 10- 25 Add Feedback Details Form
- After filling out the form, click Save and make sure a green pop-up message is displayed, refer to section 7.1 Save for more details.
- If a mandatory form field is left out or any form failed validation during the form submission a validation message box will be prompted, refer to section 7.2 Validation Message Box for more details.
Overview:
The feedback form contains different fields which are explained below:
· Application ID: A unique identifier for the application submitted by the customer. (This field is auto-filled)
· Applicant Name: The name of the customer who submitted the feedback. (This field is auto-filled)
· Applicant Gender: The gender of the customer who submitted the feedback. (This field is auto-filled)
· Applicant Contact Number: The contact number of the customer who submitted the feedback. (This field is auto-filled)
· Are you satisfied with the Service Quality?: Indication of whether the customer is satisfied with the Service Quality.
· Did the sanitation workers wear PPE during desludging?: Indication of whether the service provider is wearing Personal Protective Equipment (PPE).
- Comments: Place for the customer to share their thoughts, opinions, or feedback on the service.
iv. Generate Report
Generate report button is activated once the emptying form is filled. Generated report button can be accessed from the Action Column of the Application page. Clicking on the Generate report button generates a PDF report reflecting the current status of the application p to the point it has reached.
· Click on the ‘Generate Report’ button.

- This redirects to the Report page.
Overview:
The user can view the detailed report that has been generated for the selected application.
· After clicking the Generate Report, user is able to download the pdf report for each application.
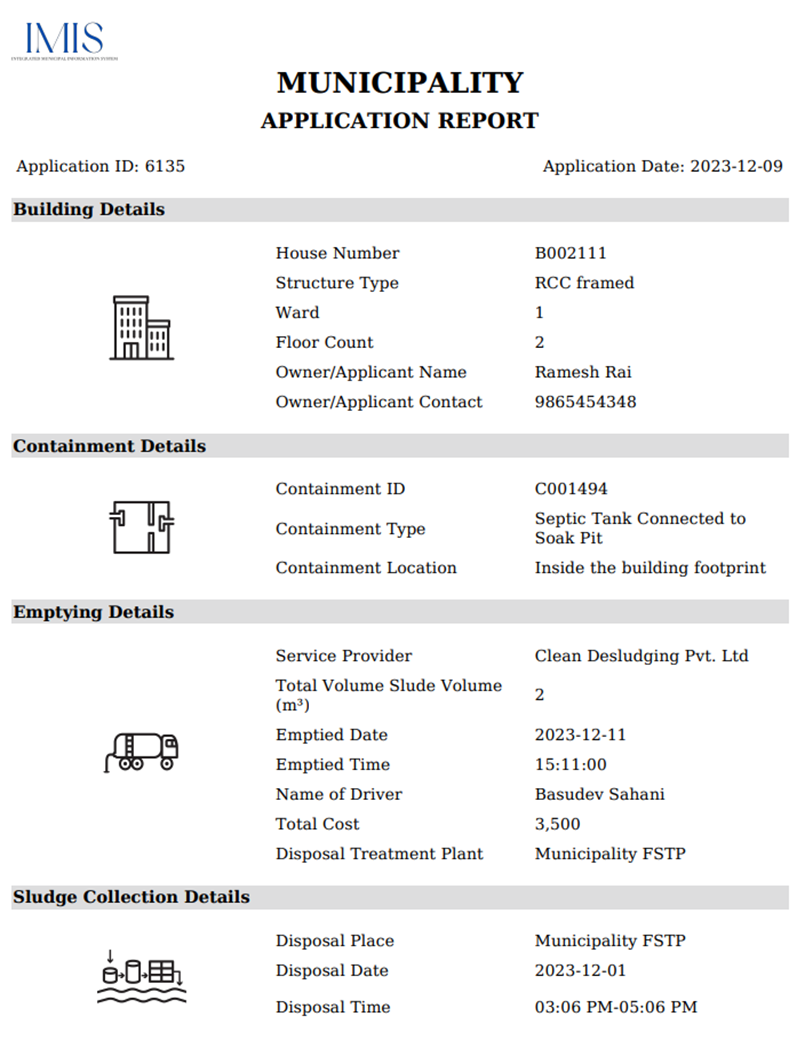
Figure 10- 26 Report generated of a particular application
· The top most part of the pdf contains the applicant’s property details. This includes key details such as the house number, structure type, ward, floor count as well as the owner/ applicant name and contact information.
- The middle section contains the containment and emptying details. The containment details encompass the containment id, type and location. The emptying details include the service provider, total volume of sludge, emptied date, driver’ name, total cost and the disposal treatment plant information.
· The bottom section contains the specifics concerning the sludge collection. It includes disposal place, date and time.
Note:
Deletion of Application data is not permitted when it is associated with emptying data.
10.6.2 Emptying
The Emptying sub-module maintains the information about the emptying history of the containments. It contains information regarding the emptying of the containment.
• Open the sidebar and click on ‘Fecal Sludge IMS’ to expand.
• Now, click on the ‘Emptying Service IMS’ and select ‘Emptying’.
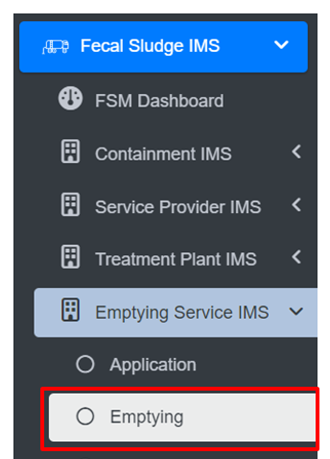
• This redirects to the Emptying page.
Overview:
· User can see the list of emptied containments in the emptying page.
· The Emptying page is to view, export and filter the data that is updated through the application page.
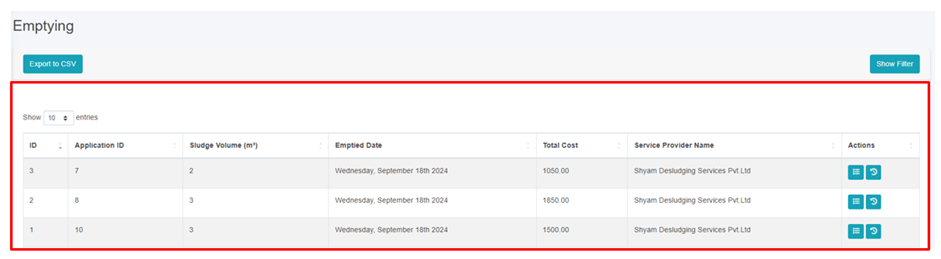
Figure 10- 27 List of Emptied Containments
· To add the emptying service status, navigate to the Application page and click on the Add Emptying Service Details button (refer to section 10.6.1.d. i Add Emptying Service Details).
· View the detailed information on the Emptying (refer to section 6.5 Show Details of Record).
· Check the history of the record (refer to section 6.2 View History).
· Export data (refer to chapter 8 Tools) and filter data (refer to chapter 5 Filters).
Note:
- Deletion of Emptying data is not permitted when it is associated with sludge collection data.
- Deletion of Emptying data is not permitted when it is associated with feedback data.
- If Emptying has been submitted 24 hours ago and the user is not super-admin or sanitation department then deletion is not permitted.
10.6.3 Sludge Collections
The Sludge Collection sub-module maintains the information related to the sludge collection at the treatment plant.
· Open the sidebar and click on ‘Fecal Sludge IMS’ to expand.
· Now, click on the ‘Emptying Service IMS’ and select Sludge Collections.
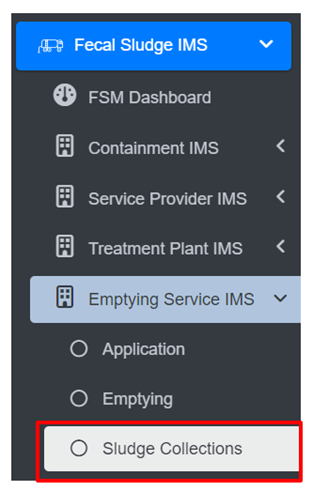
- This redirects to the Sludge Collections page.
Overview:
· User can view the lists of sludge collected from the treatment plant.
· The Sludge Collections page is to view, export and filter the data that is updated through the application page.
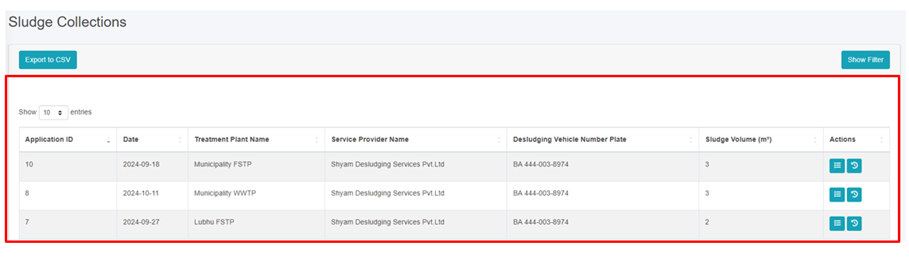
Figure 10- 28 List of Sludge Collection
· To add the sludge collection status, navigate to the Application page and click on the Add Sludge Collection Details button (refer to section 10.6.1 d ii Add Sludge Collection Details).
· View the detailed information of the Sludge Collection (refer to section 6.5 Show Details of Record).
· Check the history of the record (refer to section 6.2 View History).
· Export data (refer to chapter 8 Tools) and filter data (refer to chapter 5 Filters).
Note:
- If the creation date of the sludge record is more than 24 hours prior to the current date, deletion is permissible. The same criteria apply to editing records. If this condition is not met, only individuals with superadmin and the Sanitation Department are authorized to delete the records.
10.6.4 Feedbacks
The Feedback History sub-module maintains the information regarding a list of feedback collected.
· Open the sidebar and click on ‘Fecal Sludge IMS’ to expand.
· Now, click on the Emptying Service IMS and select Feedbacks.
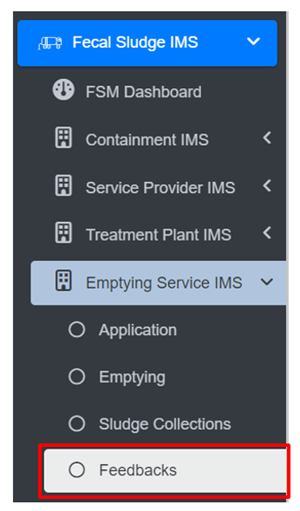
· To add the feedback, navigate to the Application page and click on the Add Feedback Details button (refer to section 10.6.1 d iii Add Feedback Details).
· View the detailed information of the Feedback (refer to section 6.5 Show Details of Record).
· Check the history of the record (refer to section 6.2 View History).
- Export data (refer to chapter 8 Tools) and filter data (refer to chapter 5 Filters).
Overview:
· User can view the lists of Feedback which is collected from the applicants.
· The Feedback page is to view and export the data that is updated through the application page.
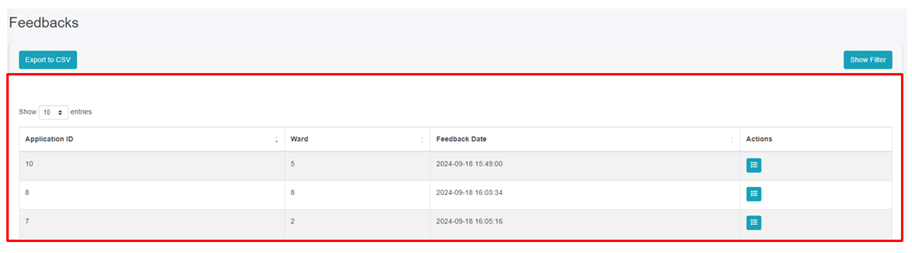
Figure 10- 29 List of Feedback
Note:
· Edit and Deletion of Feedback data is permitted only by super-admin and sanitation department.
· One help desk cannot delete feedback data created by another help desk.
Feedback created at, is more than 24 hours old from the current date, deletion is allowed. The same rule applies to editing. If this time frame has not been met, only super-admin is permitted to delete records.
10.6.5 Help Desks
The Help Desks sub-module maintains information related to the help desk established within the city.
• Open the sidebar and click on the ‘Fecal Sludge IMS’.
• Now, click on the ‘Emptying Service IMS’ and select Help Desks.
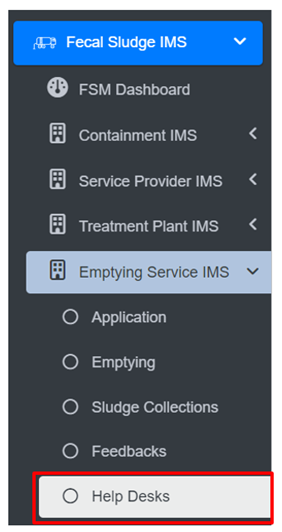
• This redirects to the Help Desks page.
Overview:
User can view the list of help desk created and provides different Filters, Actions and Tools that can be used according to the requirements. For more details (refer to section 5 Filters, section 6 Actions and section 8 Tools).
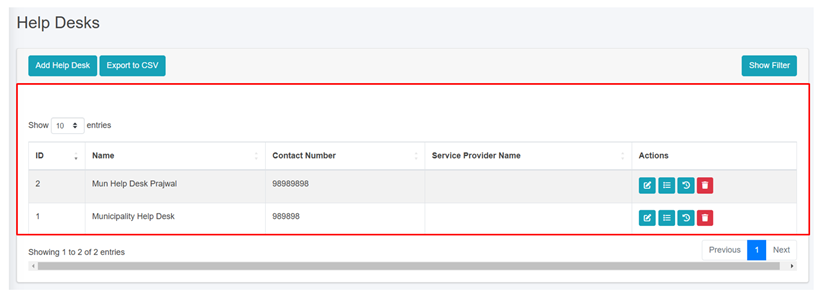
Figure 10- 30 List of Help Desk
b) Add Help Desk
· Click on the ‘Add Help Desks’ button.
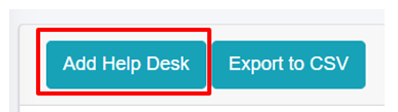
· This redirects to the Add Help Desk form page.
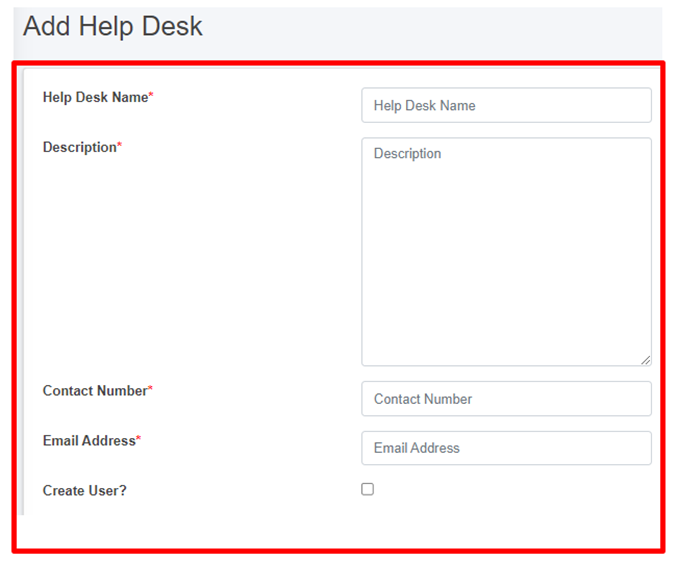
Figure 10- 31 Add new Help Desk
- After filling out the form, click Save and make sure a pop-up message is displayed, refer to section 7.1 Save for more details.
- If a mandatory form field is left out or any form failed validation during the form submission a validation message box will be prompted, refer to section 7.2 Validation Message Box for more details.
Overview:
The form fields of the help desks are explained below:
· Help Desk Name - Name of the help desk.
· Description - Additional information about the help desk
· Contact Number - Contact number of the help desk (It takes numeric values only).
· Email Address - Email address of the help desk
If the "Create User" option is chosen, it is essential to fill in both the "Password" and "Confirm Password" fields, and then the access credentials will be created as well. However, for existing user who do not select the "Create User" option, the password-related fields will not be shown.
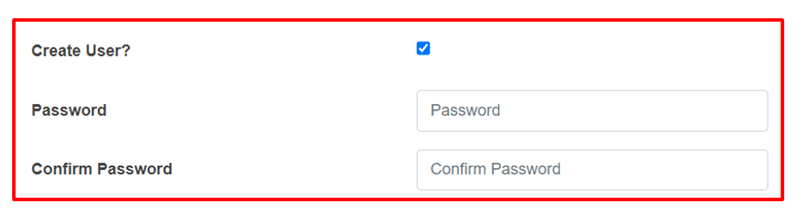
- When the user selects “Create user”, a new help desk user will be created with the corresponding credentials.
Note:
· Deletion of Help Desk data is not permitted when it is associated with User data.
Sewer Connection Information Support System (SCIMS)
The SCIMS is a core module that enables the city to maintain information on new sewer connections established between a building and sewer network within the city. This module provides a native mobile application (android) that allows the collection of the unique ID of both the building and the corresponding sewer network through a field survey. The collected building ID as well as sewer ID are maintained by this module, and once approved it is reflected in the BIMS, which updates the sanitation system and utility information of the building.
11.1 Sewer Connection IMS
· Open the sidebar and select ‘Sewer Connection IMS’.

Overview:
· The user can see the list of sewer connection data which is collected through mobile application.
· User can approve sewer connection by clicking on the Approve button in the action column (refer to section 11.1.2 Approve Sewer Connection).
· Preview the location of the building (refer to section 11.1.3 Preview Sewer Connected to Building Location).
· Delete the record if necessary (refer to section 6.3 Delete Record).
· Filter the data (refer to section 5 Filters).
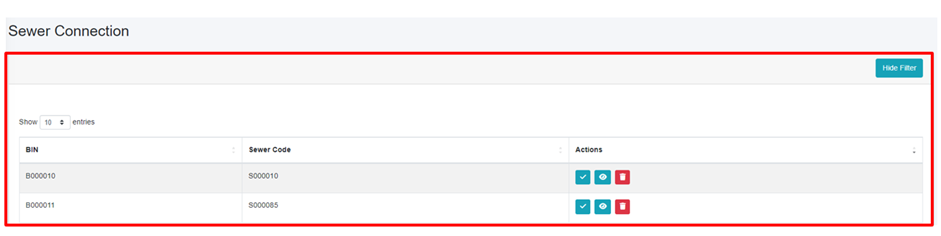
Figure 11-1 Sewer Connection Lists
The Building Code (BIN) and Sewer Code are collected via mobile application; after submitting the sewer data from the mobile app, the data is then sent to the web which is displayed in the Sewer Connection module. For detailed instructions on the sewer connection information collection process, refer to the Sewer Connection Information Collection Mobile App User Manual.
11.1.2 Approve Sewer Connection
· Click on the Approve button in the Action Column.

· Upon clicking the “Yes” button in the confirmation dialog box, the existing sanitation system status of the building will be updated to a sewer network and any associated containment connections will be removed. If there is a corresponding containment connection, it will be removed. Selecting “No” will keep the existing record unchanged.
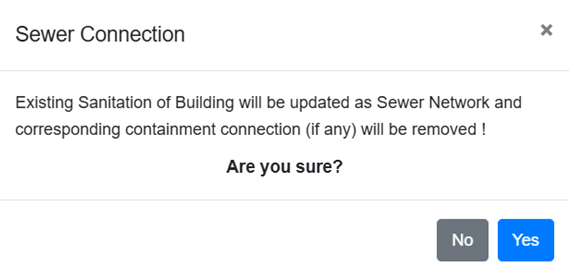
Figure 11- 2 Confirmation box for approving the sewer connection request
11.1.3 Preview Sewer Connected to Building Location
· To view the location of the building connected to the sewer click the Eye button.
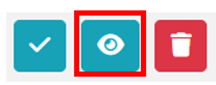
Overview:
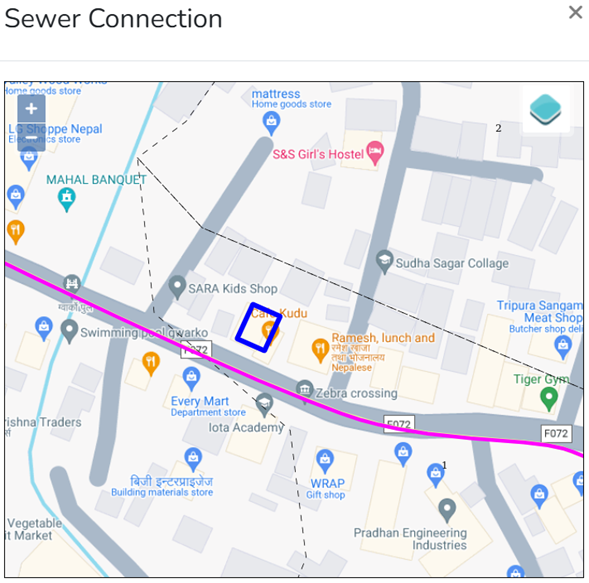
Figure 11- 3 Preview building location (KML viewer)
PT/CT IMS
PHISS is another core module of the IMIS, designed to empower municipalities in monitoring and addressing public health and sanitation challenges. PHISS enables the collection and maintenance of water sample data from various sources, including groundwater, surface water, and treated wastewater, to ensure compliance with water contamination standards. This functionality directly aligns with the CWIS objective of monitoring environmental outcomes associated with sanitation systems. Additionally, PHISS records and tracks cases of waterborne diseases across the city, providing municipalities with crucial data to understand and mitigate public health risks.
Introduction
PHISS effectively tracks spatial and attribute data on waterborne disease hotspots, including cases of diarrhea, cholera, dysentery, and typhoid, along with associated fatalities. Integrated with UDSS, it enables municipal authorities to analyze disease prevalence, identify causes, and implement strategic interventions for resource allocation and risk reduction in vulnerable areas.
One of the standout features of PHISS is its ability to maintain spatial and attribute data related to hotspot areas where waterborne diseases, such as diarrhea, cholera, dysentery, and typhoid, have been detected. The system also tracks fatalities linked to these diseases, offering a comprehensive overview of the impact on affected households and populations. By integrating this information with the UDSS municipal authorities can conduct detailed analyses of disease prevalence and its underlying causes. This data-driven approach enables strategic planning, targeted interventions, and efficient allocation of resources to reduce health risks in vulnerable areas.
Water sample data and waterborne cases data maintained by PHISS help municipality to monitor the CWIS indicators (i) Water contamination compliance of the water sources such as groundwater, surface water and treated wastewater, and (ii) Incidence of faecal-oral pathway diseases (e.g. diarrhea, cholera, dysentery and typhoid). With this information, municipalities can assess the effectiveness of sanitation systems in protecting public health and identify areas requiring urgent attention. By addressing these indicators, PHISS supports municipalities in achieving CWIS objectives, ensuring safe water quality and reducing the prevalence of sanitation-related diseases. The data export tools under PHISS allow users to export data in CSV, Shape and KML format where applicable.
12.1 Public / Community Toilets
· Open the sidebar and click on ‘PT/CT IMS’ to expand.
· Select the Public / Community Toilets.
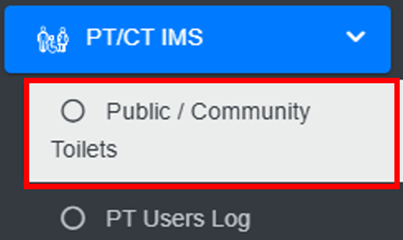
Overview:
· The Public / Community Toilets Page lists all the attribute records stored in the module and provides different Filters, Actions, and Tools that can be used according to the requirements. For more details (refer to section 5 Filters, section 6 Actions, and section 8 Tools).
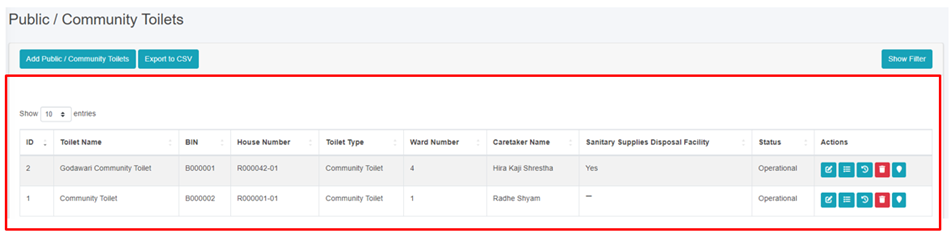
12.2 Add Public / Community Toilets
· Click on the ‘Add Public / Community Toilets’ button.
· User will be redirected to the following page:
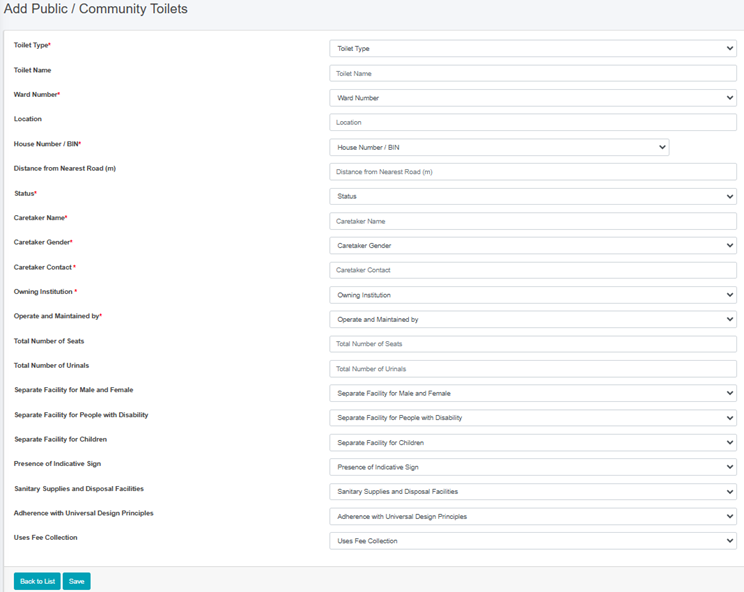
Figure 12- 2 Add new Public / Community Toilets
• After filling out the form click Save, and make sure a pop-up message is displayed, refer to section 7.1 Save for more details.
• If a mandatory form field is left out or any form failed validation during the form submission a validation message box will be prompted, refer to section 7.2 Validation Message Box for more details.
Overview:
The Add New Public / Community Toilet page consists of different form fields that capture information, as explained below:
· Toilet Type: Type of toilet such as “Public Toilet" or “Community Toilet”.
o Public Toilets (PT) is for the use of floating population/public in places such as markets, train stations, or other public areas and are used by mostly undefined users.
o Community Toilet (CT) are shared toilet facilities provided for a defined group of residents or an entire settlement/community. It is normally located in or near the community area and used by almost all community members.
· Toilet Name: Name given to the toilet.
· Ward Number: Ward number where the toilet is located.
· Location: Name of the location where the toilet is located.
· House Number/BIN: The house number identifies the building where the toilet is located and serves as its unique identifier, particularly for the building that houses the septic tank. The dropdown menu displays only the codes that are maintained in the Buildings sub-module of the Building IMS module. Additionally, it will show only buildings related to the selected toilet type. Once a building is added, it will no longer appear in the dropdown menu the next time you add a form.
· Distance from Nearest Road (m): Distance from the nearest road to where the toilet is situated.
· Status: Indicating the operational status of the toilet.
· Caretaker Name: Full name of the caretaker of the toilet.
· Caretaker Gender: The gender of the caretaker.
· Caretaker Contact: The contact number of the Caretaker of the toilet.
· Owning Institution: The selected owning institution in the form dynamically adds the field shown below:
o Name of Owning Institution: Name of the owning institution that owns the toilet.
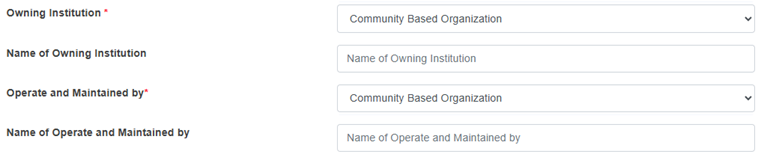
· Operate and Maintained by: The selected operate and maintained by the form dynamically adds the field shown below:
o Name of Operate and Maintained by: Name of the operator and maintainer that operates the toilet.
· Total Number of Seats: The total number of toilet seats in the public toilet or the community toilet.
· Total Number of Urinals: The total number of urinals in the public toilet or the community toilet.
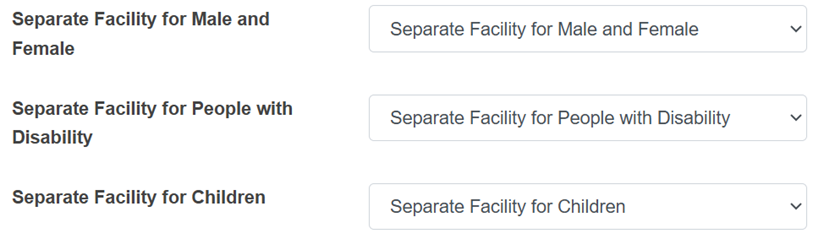
· Separate Facility for Male and Female: Indicates whether or not the toilet has separate facilities for males and females.
o If “Yes” is selected, the form dynamically adds two new fields as shown below:
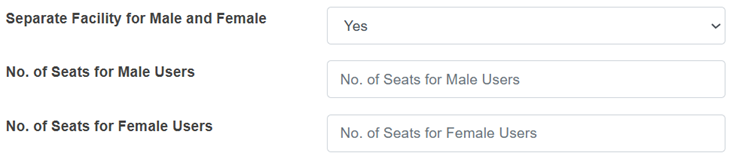
o No. of Seats for Male Users: Number of toilet seats available for male users of the public toilet. It takes numeric value only.
o No. of Seats Female Users: Number of toilet seats available for female users of the public toilet. It takes numeric value only.
· Separate Facility for People with Disability: Indicates whether or not the toilet has facilities for the differently abled people.
o If “Yes” is selected, the field shown below is added:
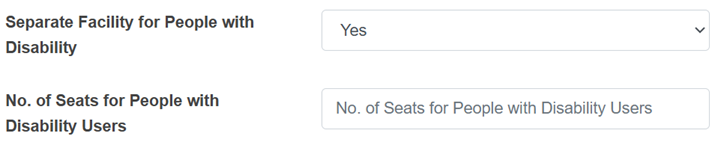
· No. of Seats for People with Disability: Number of seats available for differently abled people in the public toilet. It takes numeric values only.
· Separate Facility for Children: Indicates whether or not the toilet has facilities for children.
· Presence of Indicative Sign: Indicates whether or not the toilet has an indicative sign.
· Sanitary Supplies and Disposal: Indicates whether or not the toilet has sanitary supplies and disposal facilities.
· Adherence with Universal Design Principles: Indicates whether the toilet adheres to the universal design principles.
· Uses Fee Collection: Indicates whether a fee is collected for using the toilet. If the user selects “Yes” the form adds two input labels as shown below:
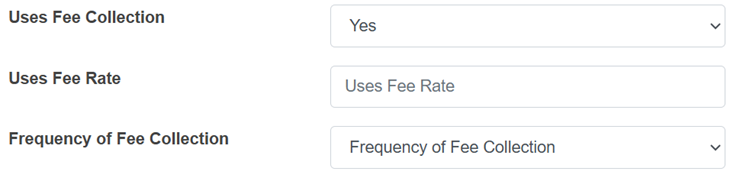
o Uses Fee Rate: The fee collected for using the toilet.
o Frequency of Fee Collected: The options for the frequency of the fee collected for public toilets is per use and for community toilets is weekly, half monthly, monthly, quarterly, and yearly.
Note:
· Deletion of public toilet data is not permitted when in use with the PT Users Module.
Deletion of community toilet data is not permitted when it is associated with building data.
12.3 PT Users Log
The PT Users Log sub-module maintains the information regarding the total number of users of the toilets on a daily basis.
· Open the sidebar and click on ‘PT IMS’ to expand.
· Select the PT Users Log.
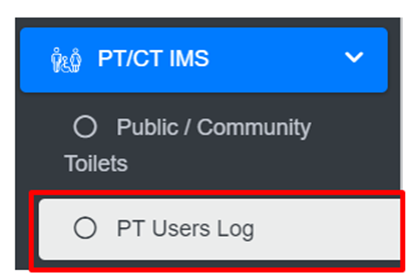
Overview:
The PT Users Log Page lists the records stored in the module and provides different Filters, Actions, and Tools that can be used according to the requirements. For more details (refer to section 5 Filters, section 6 Actions and section 8 Tools).
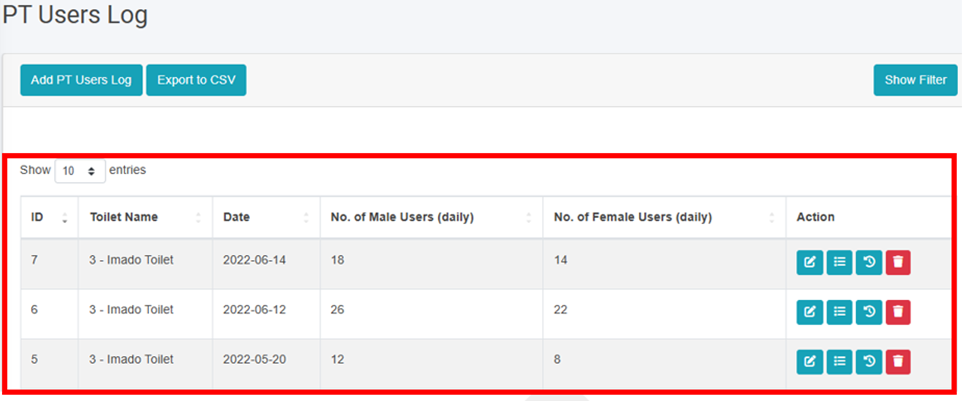
Figure 12- 3 List of PT Users Log
12.3.2 Add New PT Users Log
· Click on the ‘Add PT Users Log’ button.
• User will be redirected to the following page:
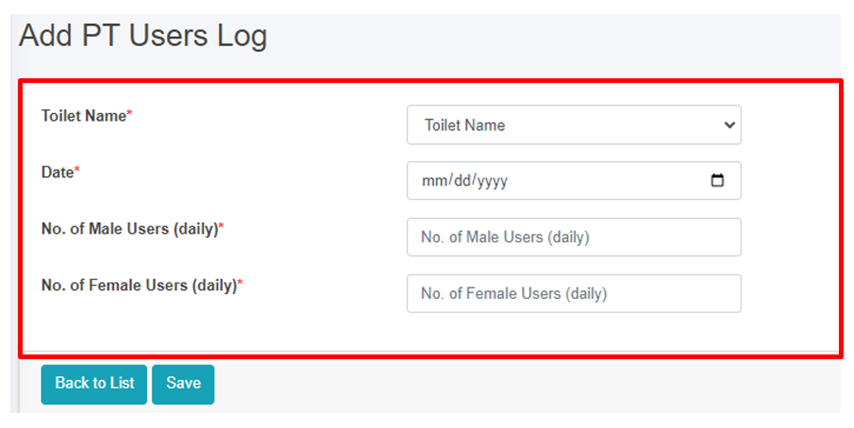
Figure 12- 4 Add new PT Users Log
• After filling out the form click Save, and make sure a pop-up message is displayed, refer to section 7.1 Save for more details.
• If a mandatory field is left out or any form failed validation during the form submission a validation message box will be prompted, refer to section 7.2 Validation Message Box for more details.
Overview:
The Add New PT Users Log page consists of information as explained below:
• Toilet Name – The user must select either a toilet name or ID if the name is not available.
• Date - The date this form is being filled.
• No. of Male Users(daily) - Total number of male users for that day.
• No. of Female Users(daily) - Total number of female users for that day.
• When the user Edits the information of the PT/CT Users Log the First two fields cannot be changed. If the user wants to make changes to the first two fields, the user will have to delete the information and add new records.
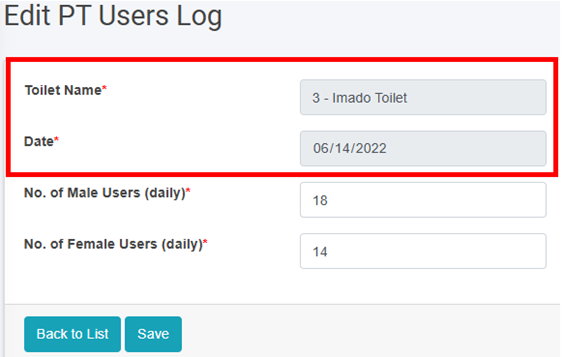
Figure 12- 5 Edit User Information
CWIS Information Management System (CWIS IMS)
CWISIMS is a vital module of the IMIS that provides tools to generate CWIS indicators for the city and Key Performance Indicators (KPIs) to monitor the performance of sanitation service providers for a specified year. The CWISIMS is a part of the UMDSS which allows municipalities to set targets for each indicator in alignment with city policies and standards, and it includes a dashboard for the visualization of these indicators. The generated indicator data is maintained in a database, enabling easy access and review when needed, ensuring effective monitoring and planning.
CWIS IMIS Introduction
CWISIMS is a vital module of the IMIS that provides tools to generate CWIS indicators for the city and Key Performance Indicators (KPIs) to monitor the performance of sanitation service providers for a specified year. The CWISIMS is a part of the UMDSS which allows municipalities to set targets for each indicator in alignment with city policies and standards, and it includes a dashboard for the visualization of these indicators. The generated indicator data is maintained in a database, enabling easy access and review when needed, ensuring effective monitoring and planning.
i. CWIS Dashboard - The CWIS Dashboard tracks 22 sanitation indicators (Annex 1), which are generated annually. The indicators are based on the CWIS framework developed by Athena Informatics, ensuring consistency with globally recognized standards for inclusive sanitation monitoring. This dashboard provides municipalities with a centralized platform for tracking sanitation progress and assessing the effectiveness of implemented policies and services.
ii. KPI Dashboard – The KPI Dashboard complements the CWIS Dashboard by focusing on the performance of sanitation service providers. It monitors seven critical KPIs (1. Application Response Efficiency, 2. Customer Satisfaction, 3. PPE Compliance, 4. Safe Desludging, 5. Faecal Sludge Collection Ration, 6. Response Time, 7. Inclusion), which are also generated annually, using sanitation service data related to faecal sludge management (FSM) service delivery. These KPIs are designed to evaluate the efficiency and quality of services provided by sanitation operators, based on metrics developed by SNV Bangladesh. By leveraging this dashboard, municipalities can benchmark service provider performance and identify areas for operational improvement within their sanitation systems.
CWISIMS, through its dual focus on CWIS indicators and KPIs, provides municipalities with robust tools for monitoring and improving their sanitation systems. By aligning indicator and KPI tracking with international standards and municipal goals, it ensures data-driven decision-making and continuous improvement in sanitation service delivery and management.
13.1 CWIS Dashboard
· Open the sidebar and click on CWIS IMS to expand.
· Select the CWIS Dashboard.
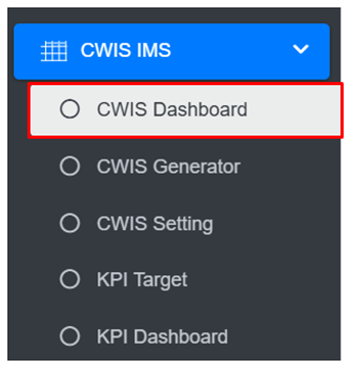
Overview:
· The CWIS Dashboard provides the CWIS indicators of the city.
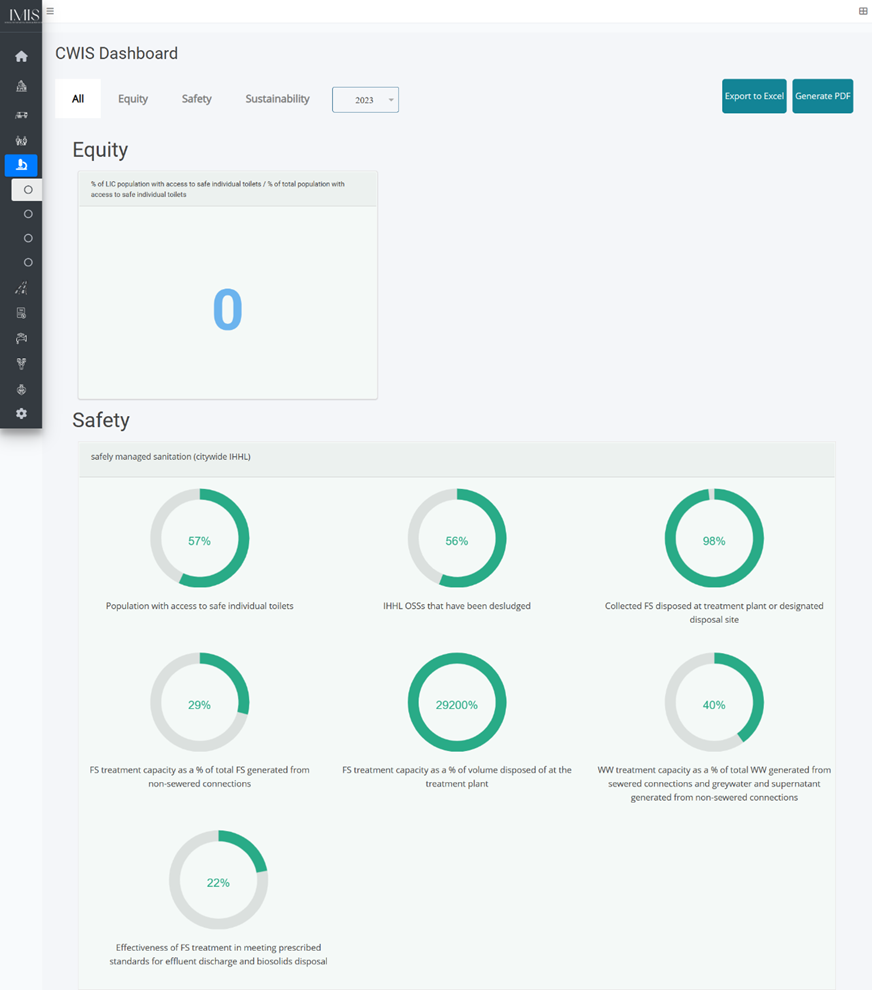
Figure 13‑1 CWIS Dashboard
13.2 CWIS Generator
CWIS can be generated through the addition of data on a yearly basis. The system is also capable of generating and compiling the yearly data.
· Open the sidebar and click on ‘CWIS IMS’ to expand.
· Select the CWIS Generator.

Overview:
The CWIS Generator page lists all the attribute records stored in the module and provides Filters, and Tools that can be used according to the requirements. For more details (refer to section 5 Filters, and section 8 Tools).
• Add CWIS Data (refer to section 13.2.2 Add CWIS Data)
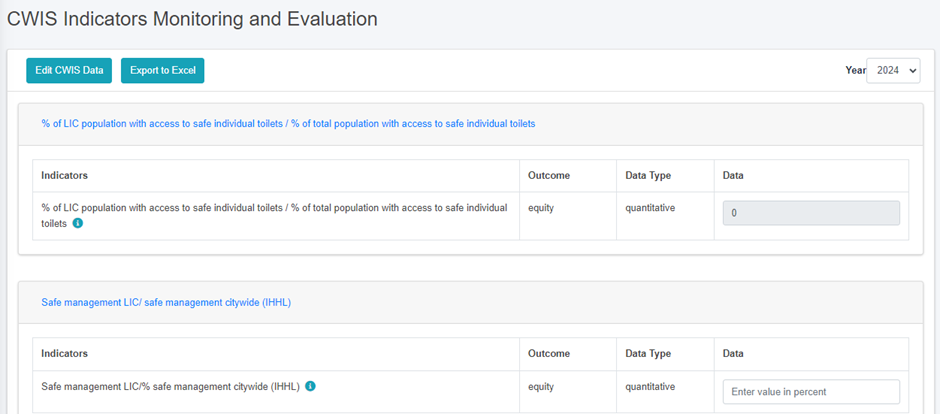
Figure 13 2 CWIS Indicators Monitoring and Evaluation
Note:
- The user must add the correct and accurate values in the CWIS Settings Page in order to display the accurate calculation of indicators. Refer to Section 13.2.2 Add CWIS Data for more details.
13.2.2 Add CWIS Data
· Click on the Add CWIS Data button to add new CWIS Data and it is also capable of generating the yearly data at the end of the year.
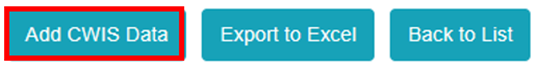
· This redirects to the Data Framework for Monitoring and Evaluation form page.
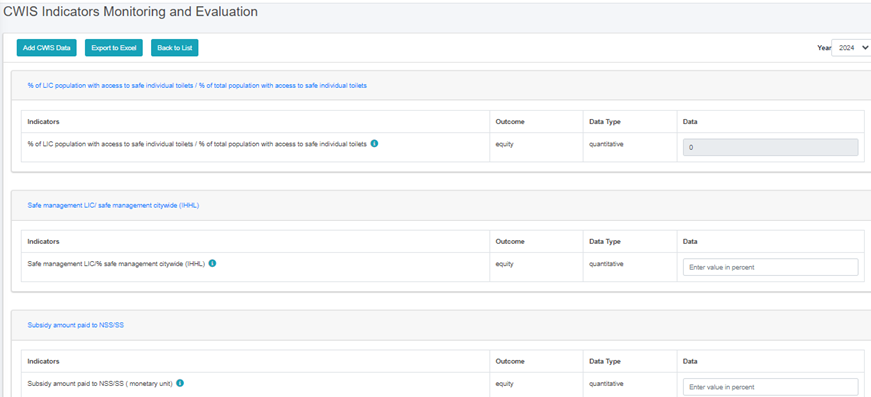
Figure 13‑3 Add CWIS Data
After filling out the form click Save and make sure a pop-up message is displayed, refer to section 7.1 Save for more details.
13.3 CWIS Settings
CWIS Setting sub-module also set the standard parameter for the module that is CWIS Generator, when interacted the web-application. CWIS Generator displays the data of the module whereas CWIS Settings is the standard values which is used according to CWIS Indicator(SF_1g).
· Open the sidebar and click on the ‘Settings’ to expand.
· Select the CWIS Setting.
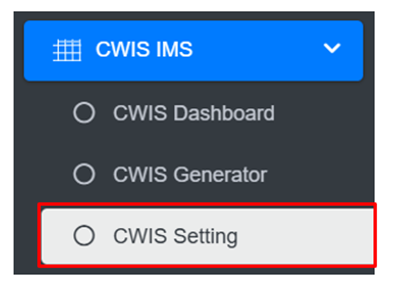
- This redirects to the CWIS Settings page.
Overview:
· The user can view the general information maintained by the sub-module and carry out different processes as required.
· The user can Edit the CWIS Setting.
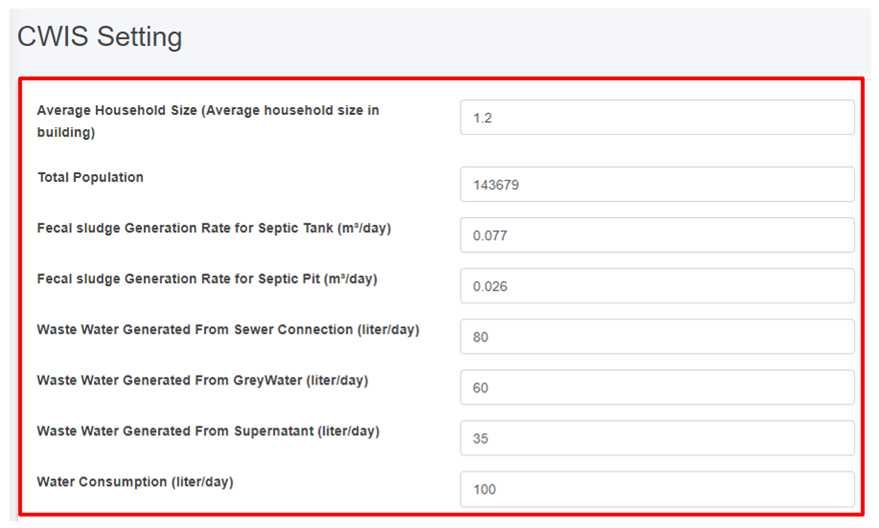
Figure 13- 4 Edit CWIS Settings form page
After Editing is completed click Save and make sure a pop-up message is displayed, refer to section 7.1 Save for more details.
The fields that are displayed while editing the form are mentioned below:
· Average Water Consumption (LPCD):
· Waste Water Conversion Factor (%):
· Greywater Conversion Factor Connected To Sewer (%):
· Greywater Conversion Factor Not Connected To Sewer (%):
13.4 KPI Dashboard
· Open the sidebar and click on ‘CWIS IMS’ to expand.
· Select the KPI Dashboard.
- This redirects to the KPI Dashboard page.
Overview:
· The KPI Dashboard contains different indicators under the KPI Target.
· The user can interact with the chart tools (refer to section 6.8).
· User can hover over the chart to get percentage information.
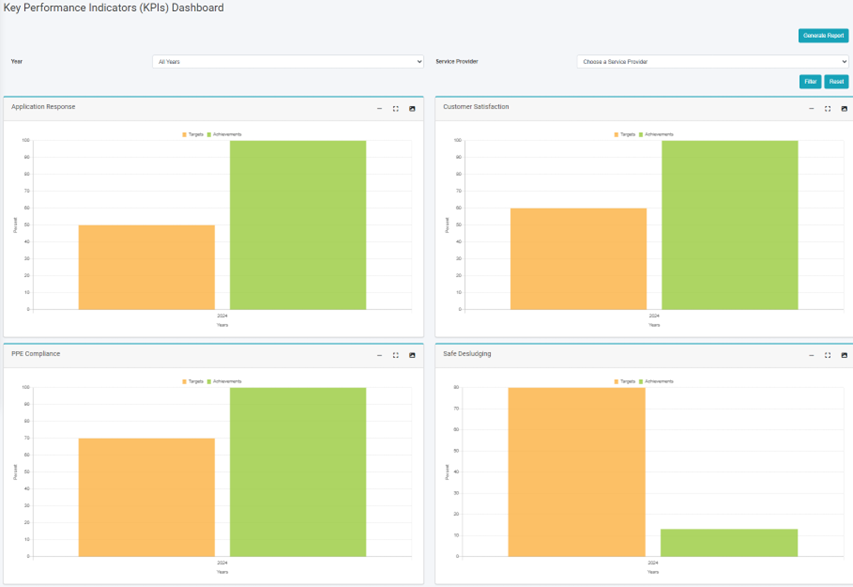
Figure 13- 5 KPI Dashboard
· The filter can be used to visualize the dashboard with the chosen data.
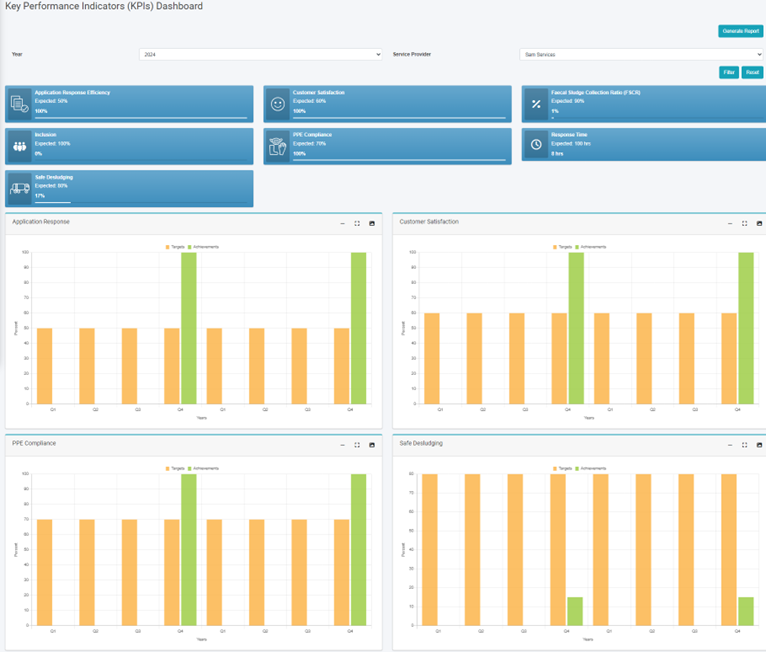
Figure 13- 6 KPI Dashboard (Filter Year)
13.5 KPI Target
• Open the sidebar and click on ‘CWIS IMS’ to expand.
• Select the KPI Target.
• This redirects to the KPI Target page.
Overview:
• The KPI Target Page lists all the attribute records stored in the module and provides different Filters, Actions and Tools that can be used according to the requirements. For more details (refer to section 5 Filters, section 6 Actions and section 8 Tools).
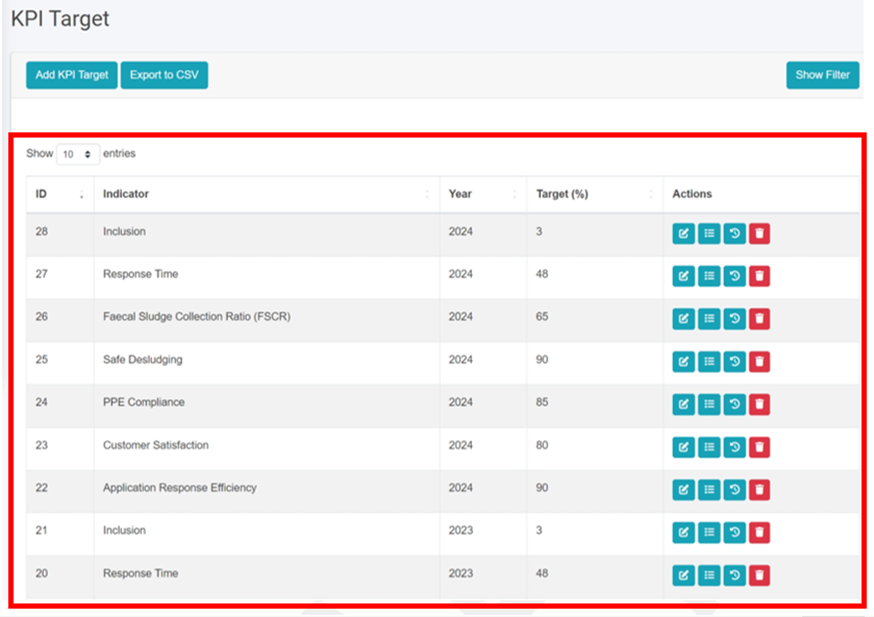
Figure 13-7 List KPI Target
13.5.2 Add KPI Target
· Click on the ‘Add KPI Target’ button.
• This redirects to the Add KPI Target form page.
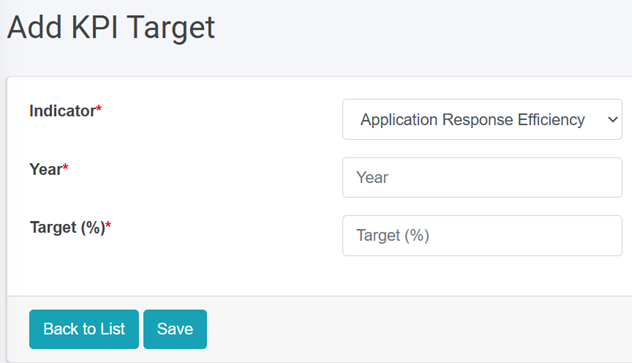
Figure 13-8 Add KPI Target
• After filling out the form click Save and make sure a pop-up message is displayed, refer to section 7.1 Save for more details.
- If a mandatory field is left out or any form failed validation during the form submission a validation message box will be prompted, refer to section 7.2 Validation Message Box for more details.
Overview:
• The Add KPI Target page consists of information that is explained below:
• Indicator – The user must choose Indicator which is available in options from the dropdown
• Year- The year that indicator was used (Do not use the same year more than once for the same indicator)
• Target (%)- The annual target set for the selected indicator.
Utility IMS
UIMS, a core module of the IMIS, is designed to manage detailed spatial and attribute data for municipal utilities such as roads, stormwater drains, water supply networks, and sewer systems. UIMS plays a critical role in achieving CWIS by enabling municipalities to monitor sanitation infrastructure, identify service gaps, and ensure equitable access to sanitation services, particularly for low-income community (LIC) areas. Through its integration with the BIMS, UIMS provides granular insights into utility connectivity for each building, including sewer and drainage links, and water supply access. This integration helps municipalities target underserved areas, plan infrastructure expansions, and prioritize investments in sanitation services.
A key feature of UIMS is its interactive dashboard, which delivers real-time visualizations on sanitation-related utilities. The system empowers municipalities to monitor sanitation coverage trends, identify gaps, and make data-driven decisions to address inequities in service delivery. UIMS also includes advanced map-based input tools integrated with the UMDSS, allowing municipalities to add or update utility infrastructure directly within the platform. Currently this tool is available for creating and updating roads only. In the case of other utilities, they need to be digitized and merged with existing data and import in corresponding utilities database of IMIS with the help of skilled GIS people. In the case of attribute data, they can be updated for all kinds of utilities directly from the user interface. UMDSS has provided tools to export data in flexible formats, such as CSV, SHP, and KML ensuring seamless sharing and integration with other municipal services.
14.1 Utility IMS
· Open the sidebar and click on ‘Utility IMS’ to expand.
· Select the Utility Dashboard.
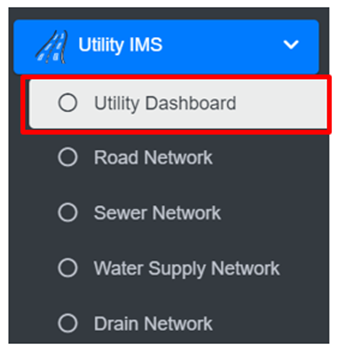
· The Utility Dashboard provides a synopsis of the information maintained in this module.
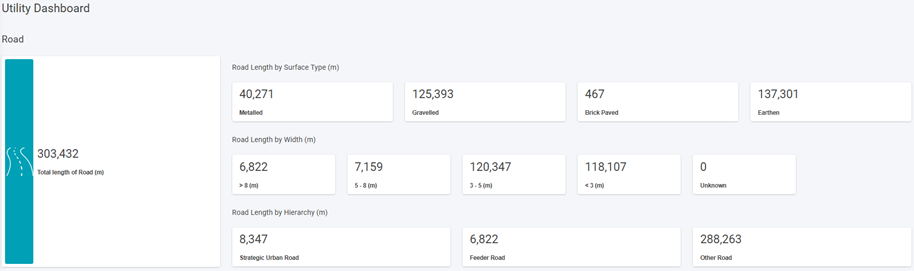
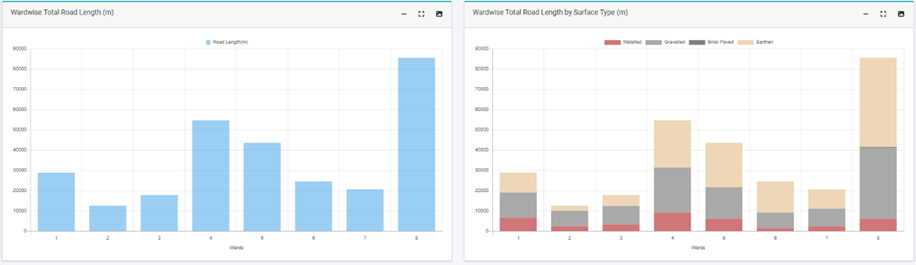
Figure 14- 1 Utility Dashboard
The dashboard typically displays a visual representation of data using graphs, pie charts, etc.
In the Utility Dashboard, bar charts are used to visually present various utility-related information.
· Road Network: length, surface types, hierarchy, and length by width
· Sewer Network: length and length by diameter
· Drain Network: length types, length by type, length by diameter.
- Water Supply Network: length and length by diameter
14.2 Road Network
The Road Network Sub-Module maintains the information regarding the road networks of the city. The road network database maintains information on various attributes that define different aspects of a road such as a road code, surface type, and hierarchy.
· Open the sidebar and click on ‘Utility IMS’ to expand.
· Select the Road Network.
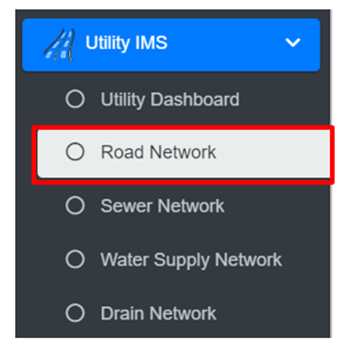
• This redirects to the Road Network page.
Overview:
The Road Network Page lists all the attribute records stored in the module and provides different Filters, Actions and Tools that can be used according to the requirements. For more details (refer to section 5 Filters, section 6 Actions and section 8 Tools).
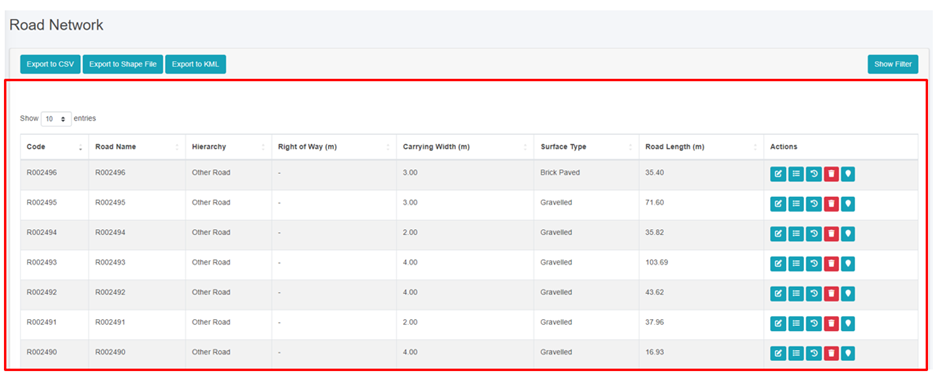
Figure 14- 2 List of Road Network
14.2.2 Add roads
· To add roads, go to the Map page.
· Click on the add road button, this will turn on sub-tool features to add the road line and its other related information.
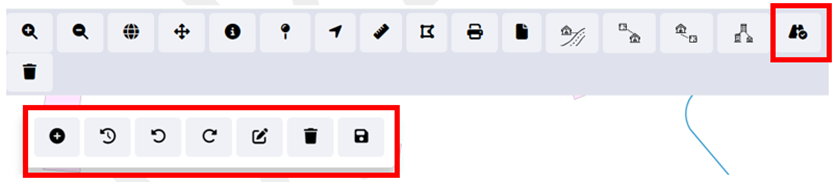
Figure 14- 3 Map Tools
· To add a new road, the user need to locate the tentative location of the starting point and ending point of a new road constructed through the map feature interface.
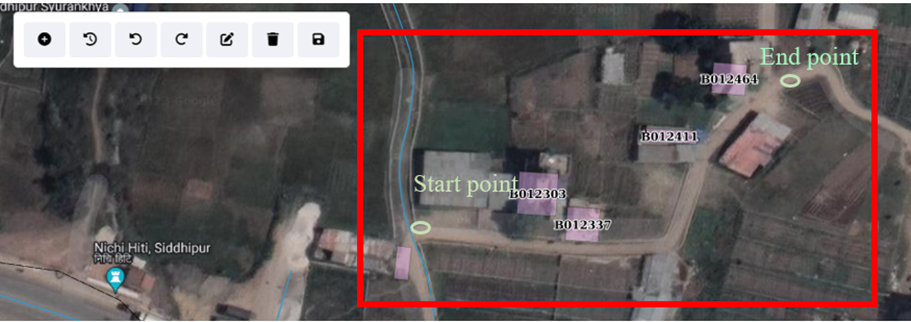
Figure 14- 4 Locating the new road section
· Once the new road section has been identified, the user must tentatively outline the new road on the map interface by creating a set of points.
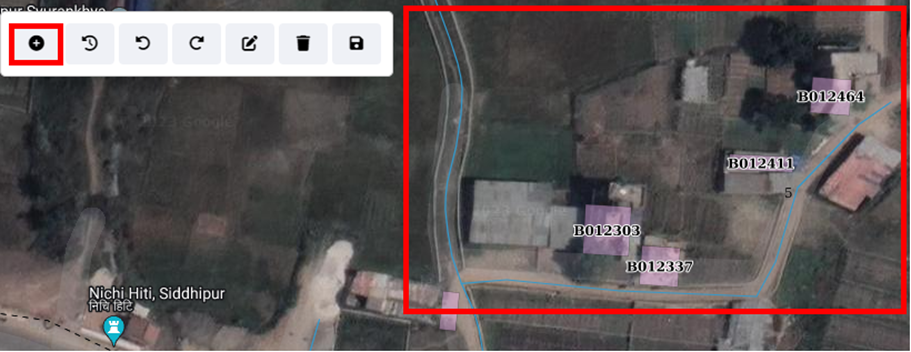
Figure 14- 5 Add new road section
· If the user is not satisfied with the drawn road line on the map, they can undo, redo, or remove it by clicking the corresponding button.
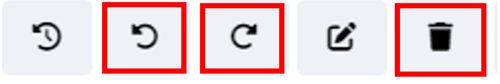
Figure 14- 6 Undo, Redo and Remove
· Upon generating an acceptable outline of the new road, the user must enter the information of the new road and save the information.
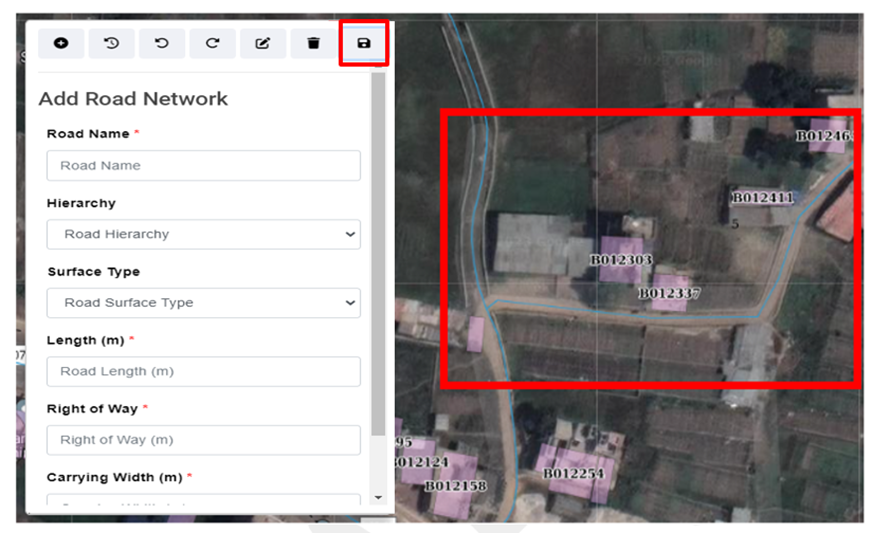
Figure 14- 7 Attribute Information of new road section
Add Road Form
· Road Name: The name of the road.
· Road Hierarchy: The hierarchy of the road from the dropdown.
· Road Surface Type: The surface type of the road from the dropdown.
· Road Length (m): The length of the added road.
· Right of Way: The width of the road designated for vehicles and pedestrians, Right of Way value must be greater than or equal to the carrying width of the road.
· Carrying Width of the Road (m): The area designated for vehicle movement, excluding non-traffic zones.
· To save a road line drawing, users must complete required fields marked with red asterisks. Submitting without completing these fields will result in an error message:
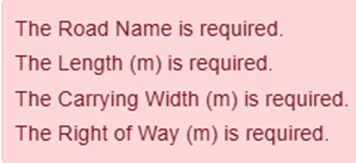 .
.
14.2.3 Edit Road
· In addition to updating new road lines, the tool offers the capability to extend or modify existing road lines directly through the map interface, providing users with a means to update road information as urban infrastructure evolves.
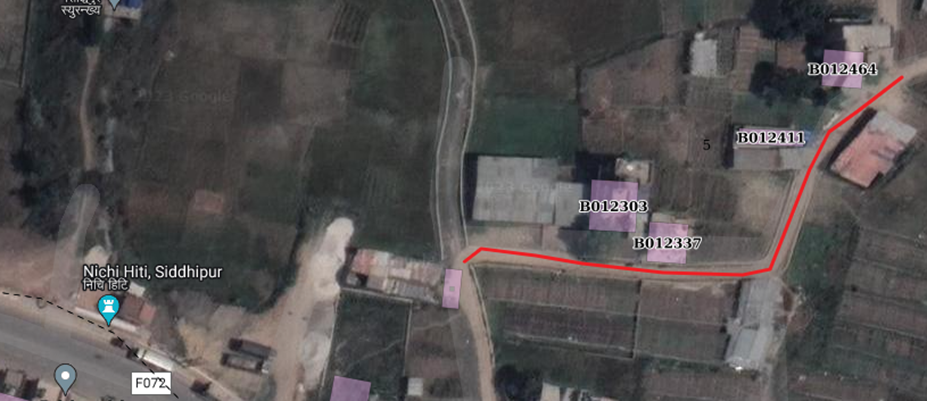
Figure 14- 8 Spatial information of new road section
· To extend an existing road or change its route, users can activate the edit feature.
· First, select the desired road from the map interface, which is highlighted for easy identification (refer to Figure 14- 8).
· Next, select a point along the road line that requires modification and dragging or moving the point to adjust its position as needed.
· This process enables precise edits to the road line's shape when necessary. Moreover, users can easily extend the road line by selecting the endpoint of the road and dragging it to reflect the actual road extension. This functionality allows users to accurately update and extend road networks directly through the map interface.
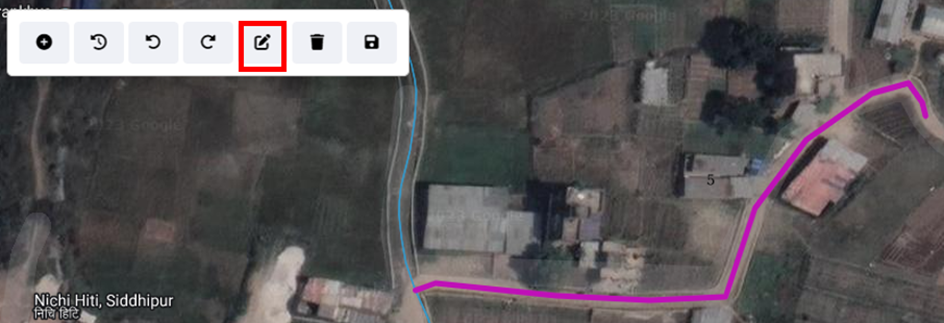
Figure 14- 9 Updated Road line
Note:
· Deletion of road data is not permitted when it is associated with building data.
· Deletion of road data is not permitted when it is associated with sewer data.
· Deletion of road data is not permitted when it is associated with water supply data.
· Deletion of road data is not permitted when it is associated with drain data.
14.3 Sewer Network
14.3 Sewer Network
The Sewer Network Sub-Module maintains the information regarding the sewer networks of the city.
• Open the sidebar and click on ‘Utility IMS’ to expand.
• Select the Sewer Network
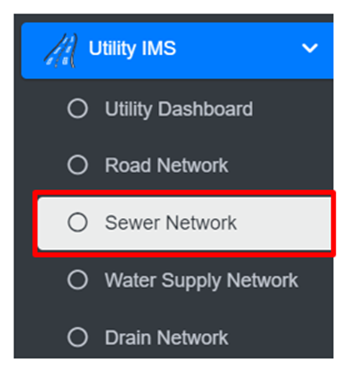
• This redirect to Sewer Network
Overview:
The Sewer Network Page lists all the attribute records stored in the module and provides different Filters, Actions and Tools that can be used according to the requirements. The For more details (refer to section 5 Filters, section 6 Actions and section 8 Tools).
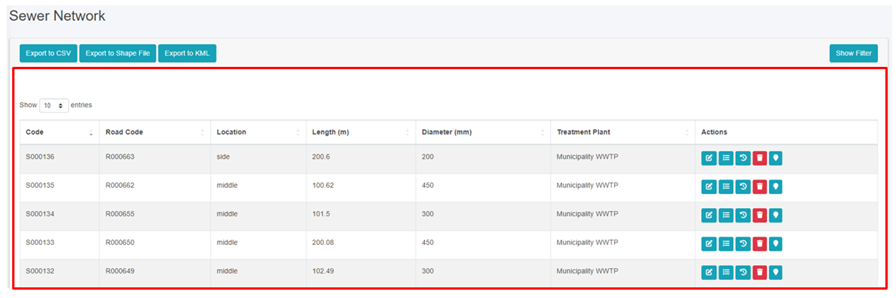
Figure 14- 10 List of Sewer Network
· The location should be:
o Middle – if the sewer network is in the middle of the road,
-
-
-
- Side - if the sewer network is on either the right or left side of the road
-
-
Note:
· Deletion of sewer data is not permitted when it is associated with building data.
· Deletion of sewer data is not permitted when it is associated with sewer connection.
14.4 Water Supply Network
The Water Supply Network Sub-Module maintains the information regarding the water supply networks of the city.
• Open the sidebar and click on ‘Utility IMS’ to expand.
• Select the Water Supply Network
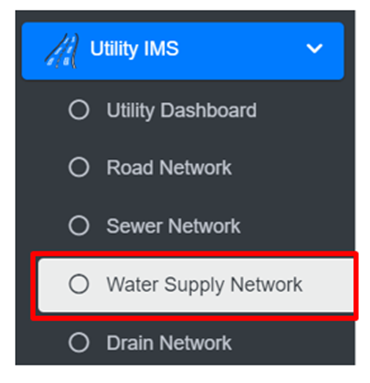
Overview:
The Water Supply Network Page lists all the records stored in the module and provides different Filters, Actions and Tools that can be used according to the requirements. For more details (refer to section 5 Filters, section 6 Actions and section 8 Tools).
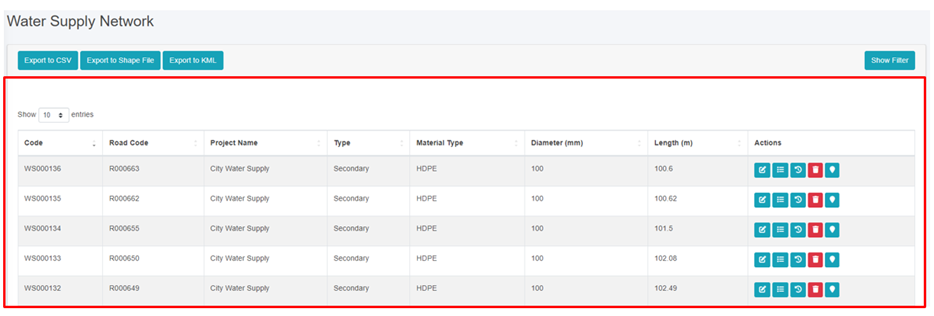
Figure 14- 11 List of Water Supply Network
Note:
· Deletion of water supply data is not permitted when it is associated with building data.
14.5 Drain Network
The Drain Network Sub-Module maintains the information regarding the Drain networks of the city.
· Open the sidebar and click on ‘Utility IMS’ to expand.
· Select the Drain Network
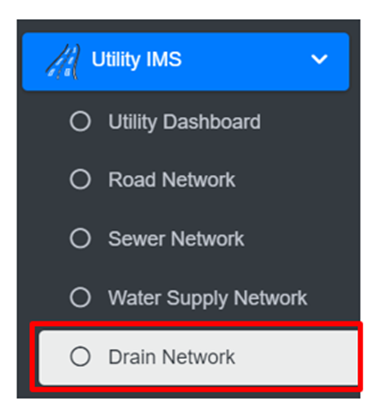
· This redirect to Drain Network
Overview:
The Drain Network Page lists all the records stored in the module and provides different Filters, Actions and Tools that can be used according to the requirements. For more details (refer to section 5 Filters, section 6 Actions and section 8 Tools).
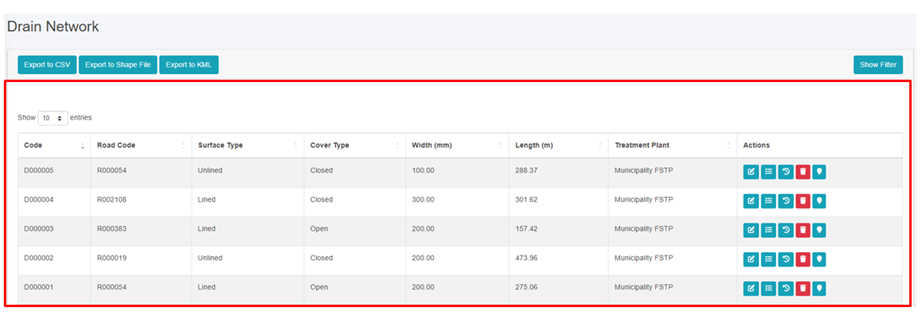
Figure 14- 12 List of Drain Network
Note:
- Deletion of drain data is not permitted when it is associated with building data.
Solid Waste Information Support System (SWISS)
The SWISS module enhances solid waste service management and fee collection by importing a municipality’s solid waste customer data in CSV format into IMIS. It maintains customer records and tracks fee payment statuses, allowing municipalities to monitor service coverage, identify discrepancies between solid waste customer data and IMIS records, and map buildings with or without services.
By integrating solid waste data with building records, SWISS provides actionable insights for optimizing resource allocation and improving service delivery. The module aids in policy formulation by visualizing service coverage and fee collection trends. However, data integration is manual and periodic, as SWISS does not yet support real-time API integration, similar to the PTCISS module.
15.1 Solid Waste ISS
The Solid Waste Information Support System sub-module imports data via CSV of the solid waste status of the buildings in the municipality.
· Open the sidebar and select ‘Solid Waste ISS’.

Overview:
· The user can view the lists of swm service payments status data including the due years.
· User can import the data via CSV of solid waste service data clicking on the “Import from CSV” (refer to section 15.1.2 Import Solid Waste ISS).
· The user can download the CSV Template to import the swm service payment data (refer to section 15.1.3).
· Export the data (refer to chapter 8 Tools) and filter data (refer to chapter 5 Filters).
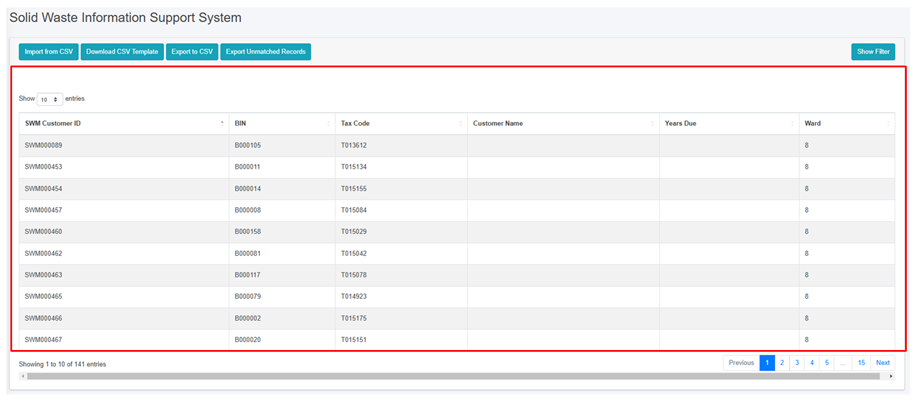
Figure 15- 1 List of solid waste service data
15.1.2 Import Solid Waste ISS
· Click on ‘Import from CSV’ at the top left of Solid Waste Information Support System page.
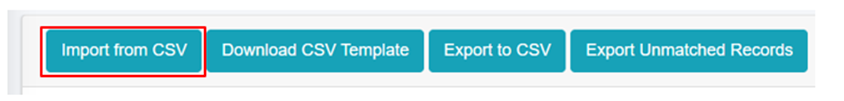
• This will redirect the user to Import Solid Waste Information Support System page.
Overview:
· The user can upload the swm service payment data including the last payment date of the building from this module.
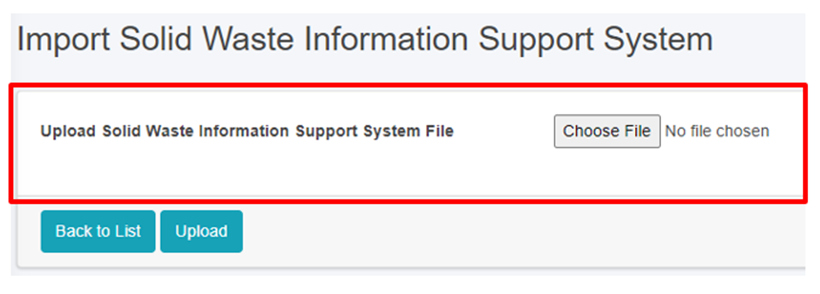
Figure 15- 2 Import Solid Waste ISS CSV File
· Once the user selects the CSV file to be imported, they must click the Upload button to import the data. The user will then be notified with a pop-up message indicating successful import, refer to section 7.3 Successfully Imported for more details.
· The system currently does not allow user to import data from any other format than csv and must the system specified data structure. In case of attempt to import data from other format system will prompt red error message of mismatched format, refer to section 7.4 Import Format Error for more details.
Note:
- The format for the Last Payment Date must be of mm/dd/yyyy (eg: 8/21/2022 which implies August 21st 2022)
15.1.3 Download CSV Template
· Click on the ‘Download CSV Template’ button at the top left of the Solid Waste Information Support System page.
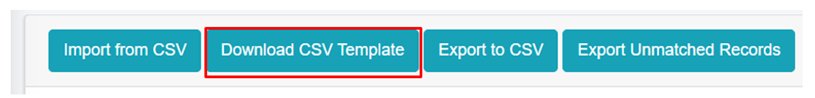
Overview:
· A CSV template file containing sample data and the required headers will be downloaded, which are essential for importing the csv file.
· Download CSV Template is available only in the Property Tax Collection ISS, Water Supply ISS, and Solid Waste ISS modules.
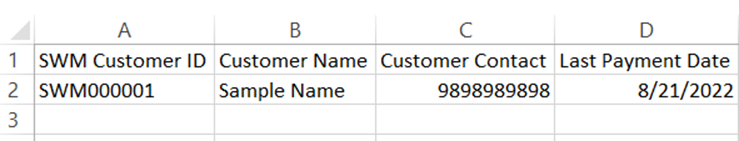
Figure 15- 3 Downloaded Solid Waste ISS CSV Template
Property Tax Collection Information Support System (PTCISS)
PTCISS is a value-added module within the Integrated Municipal Information System (IMIS) that helps municipalities monitor and manage property tax collection using map-based visualization tools. It allows authorities to import property tax data via CSV format, integrating it into IMIS for graphical and map-based analysis using UMDSS tools.
By mapping tax data, PTCISS identifies high-default areas and efficient collection zones, enabling municipalities to enhance tax collection strategies, compliance policies, and equitable tax management. It also provides Data Export Tools to highlight discrepancies between IMIS building records and tax department data, ensuring accuracy and transparency.
Currently, data updates are manual and periodic, but PTCISS is designed to support future real-time API integration if municipal tax systems allow connectivity. By leveraging its insights, municipalities can streamline tax management, improve revenue collection, and enhance urban governance.
Introduction
PTCISS is a value-added module integrated into the Integrated Municipal Information System (IMIS), designed to help municipalities monitor and manage property tax collection citywide through powerful map-based visualization tools. It enables city authorities to import property tax data maintained by the municipal property tax collection department into IMIS using a user-friendly data import tool supporting CSV formats. Once the data is integrated, property tax collection information is displayed in graphical formats on the IMIS dashboard and visualized on maps using tools provided by UMDSS. This facilitates quick and intuitive analysis of tax collection status across various parts of the city.
Mapping property tax data provides actionable insights by identifying high-default areas (regions with a significant number of defaulters) and efficient collection zones (areas with fewer defaulters or higher compliance rates). These insights enable the property tax department to focus on areas requiring attention, thereby improving efficiency and compliance. The information generated by PTCISS empowers city authorities to engage in strategic planning and evidence-based decision-making, allowing them to: (a) develop better tax collection strategies, (b) formulate effective policies to increase compliance, and (c) plan for equitable tax management across different city regions.
PTCISS also includes Data Export Tools, enabling municipal authorities to export building data along with their tax payment status. Additionally, it highlights mismatched tax records between the building data maintained in IMIS and the input tax data provided by the property tax department. This functionality helps identify and resolve discrepancies, ensuring data accuracy and transparency.
Currently, PTCISS relies on periodic manual updates using CSV-based imports to maintain data accuracy. However, the system is designed to be future-ready, with the capability to support real-time data integration through an API if the city’s property tax collection system provides connectivity access. This upgrade would enable automated and efficient data synchronization as municipal technology evolves.
By leveraging the features and insights provided by PTCISS, municipalities can streamline property tax management, improve transparency, and enhance revenue collection efficiency. These improvements contribute significantly to better urban governance and equitable service delivery.
16.1 Property Tax Collection ISS
The Property Tax Collection Information Support System sub-module imports data via CSV of the tax status of the buildings in the municipality.
· Open the sidebar and select ‘Property Tax Collection ISS’.
Overview:
· The user can view the lists of the building tax payment data including the due years.
· User can import the data via CSV of building tax payments data by clicking on the ‘Import from CSV (refer to section 16.1.2 Import Property Tax Collection ISS)
· The user can download the CSV Template to import the property tax payments data (refer to section 16.1.3 Download CSV Template).
· Export the data (refer to section 8 Tools) and filter data (refer to chapter 5 Filters).
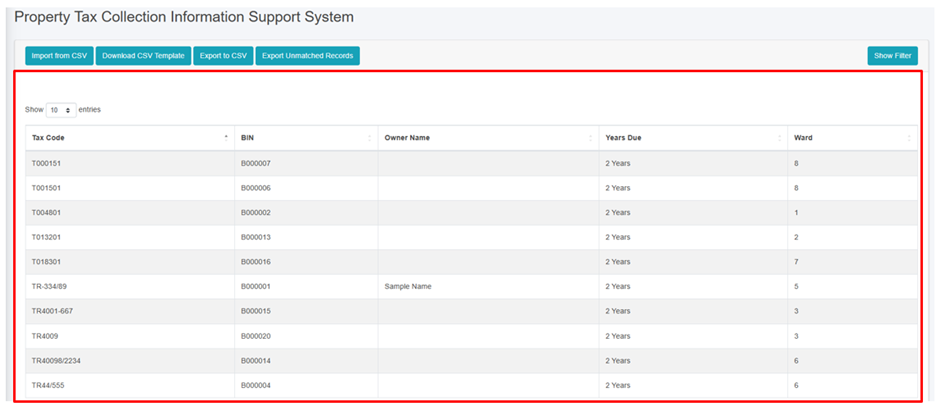
Figure 16- 1 List of Property Tax Collection ISS
16.1.2 Import Property Tax Collection ISS
· Click on ‘Import from CSV’ at the top left of the Property Tax Collection Information Support System page.
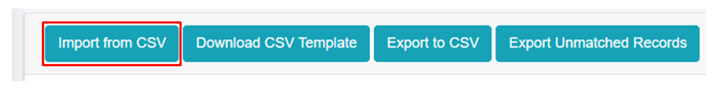
• This redirects to the Import Property Tax Collection Information Support System page.
Overview:
· The user can upload the tax payment file including the last payment date in csv format for the building tax payment of the building from this module.
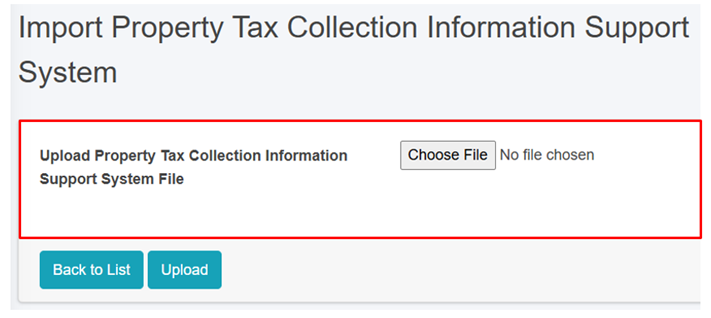
Figure 16- 2 Import Property Tax Collection ISS CSV File
· Once the user selects the CSV file to be imported, they must click the Upload button to import the data. The user will then be notified with a pop-up message indicating Successful import, refer to section 7.3 Successfully Imported for more details.
· The system currently does not allow user to import data from any other format than csv and must the system specified data structure. In case of attempt to import data from other format system will prompt red error message of mismatched format, refer to section 7.4 Import Format Error for more details.
Note:
The format for the Last Payment Date must be of mm/dd/yyyy (eg: 8/21/2022 which implies August 21st 2022).
16.1.3 Download CSV Template
· Click on the ‘Download CSV Template’ button at the top left of the Property Tax Collection Information Support System page.
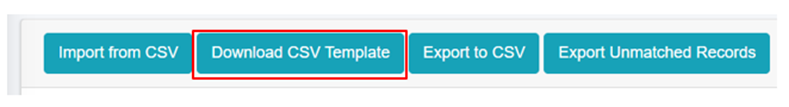
Overview:
· A csv template file containing the sample data and required headers will be downloaded, which are essential for importing the csv file.
· Download CSV Template is available only in the Property Tax Collection ISS, Water Supply ISS Modules, and Solid Waste ISS module.
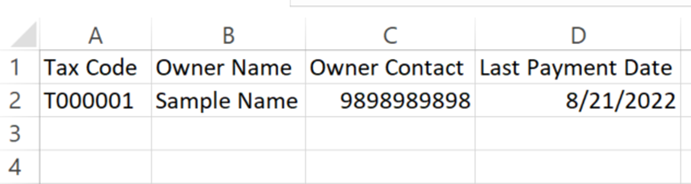
Figure 16- 3 Downloaded Property Tax Collection ISS CSV Template
Water Supply Information Support System (WSISS)
The WSISS is another value-added module within the IMIS, designed to enhance the management of water supply services and fee collection. The WSISS includes a data importing tool that allows municipalities to upload water supply customer data, including their last fee payment date, in CSV format. Based on this imported data, the WSISS module generates and maintains records of water supply customers along with their fee payment status. It also provides tools to export building data with their water supply service and fee payment statuses and highlights discrepancies by identifying records present in the municipality’s water supply customer database but missing in IMIS.
Using the imported data, the UMDSS in IMIS enables municipal authorities to visualize the water supply fee payment status of buildings in maps of the City within IMIS. This capability allows municipalities to monitor fee collection statuses and assess geographic trends in water supply fee payments. By integrating water supply customer data with building information in IMIS, the WSISS module equips municipal authorities with actionable insights to make informed decisions regarding water supply services.
The visualized data provided by WSISS supports the development of policies aimed at improving water supply fee collection processes, optimizing resource allocation, and enhancing overall service delivery. This integration helps municipalities target areas requiring attention, ensuring more effective and equitable water supply service management.
Currently, as with the PTCISS and SWISS modules, the integration of data into WSISS must be carried out manually on a periodic basis to maintain accuracy.
17.1 Water Supply ISS
The Water Supply Information Support System sub-module maintains information on Water Supply Bill Payment data.
· Open the sidebar and select the Water Supply ISS.

Overview:
· The user can view the lists of water supply payment data.
· User can import the data via CSV of water supply payment data by clicking on the ‘Import from CSV (refer to section 17.1.2 Import Water Supply ISS)
· The user can download the CSV Template to import the water supply payment data (refer to section 17.1.3 Download CSV Template).
· Export the data (refer to chapter 8 Tools) and filter data (refer to chapter 5 Filters).
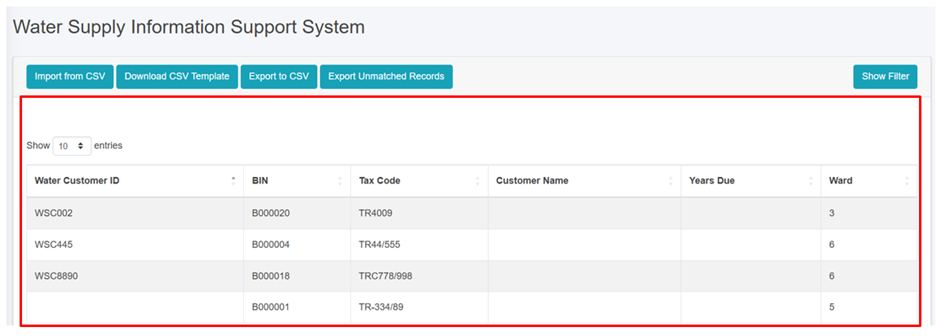
Figure 17- 1 List of Water Supply ISS
17.1.2 Import Water Supply ISS
The Water Supply Information Support System List displays key attributes of the imported Water Supply Information Support System data. The Filter tools enable the user to filter out data as required. The Tools provide the user with the ability to import data from csv records and export them in CSV.
· Click on ‘Import from CSV’ at the Top Left of the Water Supply Information Support System page.
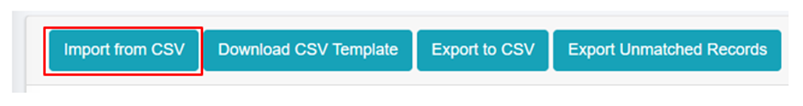
Overview:
· The user can upload the water supply payment data including the last payment date in csv format to this module.
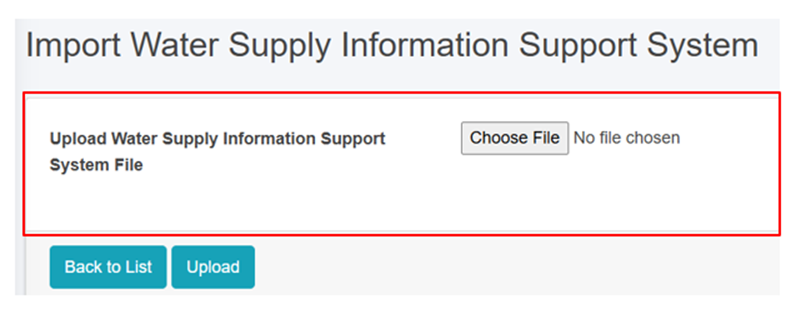
Figure 17- 2 Import Water Supply ISS CSV File
· Once the user selects the CSV file to be imported, they must click the Upload button to import the data. The user will then be notified with a pop-up message indicating Successful import, refer to section 7.3 Successfully Imported for more details.
· The system currently does not allow user to import data from any other format than csv and must the system specified data structure. In case of attempt to import data from other format system will prompt red error message of mismatched format, refer to section 7.4 Import Format Error for more details.
Note:
- The format for the Last Payment Date must be of mm/dd/yyyy (eg: 8/21/2022 which implies August 21st 2022).
17.1.3 Download CSV Template
· Click on the ‘Download CSV Template’ button at the top left of the Water Supply Information Support System page.

Overview:
· A csv template file containing the sample data and required headers will be downloaded, which are essential for importing the csv file.
· Download CSV Template is available only in the Property Tax Collection ISS and Water Supply ISS Modules, and Solid Waste ISS module.

Figure 17- 3 Downloaded Water Supply ISS CSV Template
Urban Management DSS
UMDSS is a core tool within IMIS, offering spatial analysis, mapping, data export, and dashboard visualizations to support evidence-based planning, management, and monitoring of sanitation systems, services, and broader urban management activities.
In addition to the UMDSS module, several IMIS components are integrated into UMDSS, including:
- IMIS Dashboard
- Building Dashboard (BIMS)
- FSM Dashboard (FSIMS)
- Utility Dashboard (IMIS)
- CWISIMS Module, which includes the CWIS and KPI dashboards
These tools collectively enhance decision-making, urban management, and service delivery monitoring.
Urban Management DSS Introduction
The UMDSS is one of the core and powerful tools in IMIS, it provides advanced capabilities for spatial analysis, mapping, data export, and dashboard visualizations. These tools empower city authorities to engage in evidence-based planning, management, monitoring, and decision-making for planning, management and monitoring and evaluation of sanitation system and services as well as a broader municipal urban management activity. In addition to the UMDSS module, there are IMIS Dashboard, Building Dashboard under BIMS, FSM Dashboard under FSIMS, Utility Dashboard of IMIS, CWISIMS Module including CWIS and KPI dashboard under CWISIMS are also has been considered as the components of UMDSS.
The UMDSS provides Export Data and Map Feature Sub-modules.
Export Data:
§ The Export Data sub-module enables users to export data layers in flexible formats such as SHP and KML. Users can customize exports by selecting specific ward(s) or combining layers to suit their needs.
Map Feature:
§ The Map Feature is a powerful interactive map interface which provides a dynamic platform to visualize and analyze spatial data created by various modules and sub-modules in IMIS. It displays all spatial information with categorical styling based on attribute information, presenting summarized layers at city, ward and 0.5 km grid levels.
§ The interface includes various spatial and complex tools that provide both basic and advanced functionalities, catering to a wide range of municipal operations. From navigation and visualization to sanitation-specific analyses and data updates, these features enhance decision-making by offering precise and actionable insights. These tools are – (i) Navigation and Map Interaction Tools (Zoom In & Zoom Out, Municipal Extent, Navigate, Info, Coordinate Information, Locate Point by Coordinate, (ii) Measurement Tools (Measure Distance, Measure Area), (iii) Printing and Support Tools (Print Map, Help), (iii) Sanitation-Specific Analysis Tools (Find Nearest Road, Find Building Connected to Containment, Find Containment Connected to Building, Find Associated Building, (iv) Editing Tools (Add Roads, Remove Markers).
The integration of tools like Find Nearest Road and Containment Analysis directly supports Citywide Inclusive Sanitation (CWIS) goals, while features like Measure Area, Print Map, and Add Roads contribute to broader urban management and planning efforts. By using these tools, municipal authorities can efficiently monitor sanitation systems, plan infrastructure upgrades, and ensure equitable service delivery across the city.
§ UMDSS also offer some specialized tools – (i) Service Delivery Tools for tracking (Applications, Emptied Applications Not Reached to Treatment Plant, Containments Proposed to Be Emptied, Feedback Chart (FSM Service Quality), (ii) General Tools for tracking (Buildings by Structure Type, Property Tax Collection, Water Supply), (iii) Data Export Tools (Filter by Wards, Export Data Set, Building Owner Information), (iv) Decision Tools (Tax Due Buildings, Sewers Potential Buildings, Buildings to Sewer, Buildings to Road, Hard to Reach Buildings, Building Close to Water Bodies, Buildings Using Community Toilets, Area Population), (V) Summary Information Tools (Summary Information Buffer Filter, Water Bodies Buffer Summary Information, Wards Summary Information, Road Buffer Summary Information, Point Buffer Summary Information).
These tools enhance decision-making by providing targeted insights into property, utility, and demographic data. They allow municipalities to analyze specific areas, prioritize interventions, and support efficient planning, management and monitoring and evaluation of CWIS sanitation system and services, and overall urban management.
18.1 Export Data
All data layers stored in the IMIS system are available for export. There is an option to export layers within a specific ward. Layers can be exported in either a shape file or a KML file. This module supports further planning and analysis outside the IMIS system. Any GIS software can be used to view exported shape files. KML files can be easily viewed on Google Earth.
· Open the sidebar and click on ‘Urban Management DSS’.
· Select the Export Data.
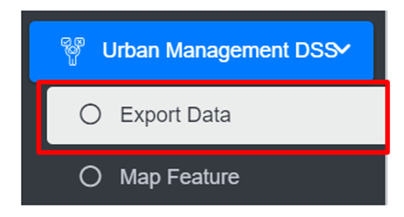
· This redirects to the Export to Shape File or Kml page.
Overview:
· Fill out all the required fields.
· Enter a specific data layer that the user is interested in exporting. The checklist available in the Layers filter is not mutually exclusive, therefore the user has the option of selecting all layers, a specific data layer, or multiple data layers.
· Choose a desired spatial Filter between Wards. Depending upon the chosen spatial Filter, the user is provided with an option to select Wards. The checklist available in the Wards filter is not mutually exclusive, therefore the user can select more than one Wards if desired.
· Choose a desired export format between the Shape and KML files. A zipped file will be downloaded when the shape file is chosen.
· Click on the ‘Download’ button.
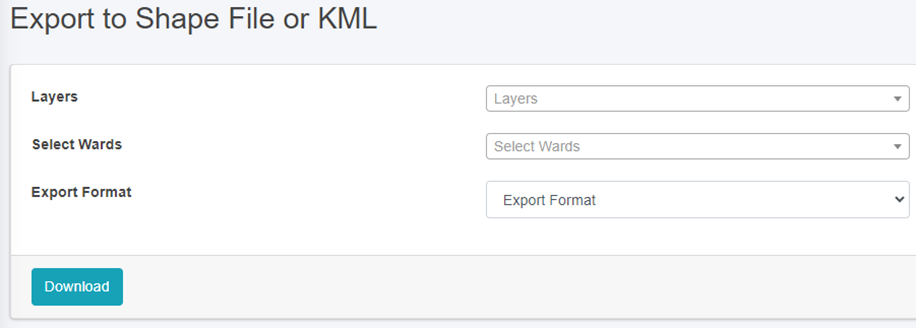
Figure 18- 1 Export to Shape File or KML file page
18.2 Map Feature
This is the main graphical web interface of IMIS where spatial visualization of data layers and other spatially assisted decision-making processes will be performed.
· Open the sidebar and click on the Urban Management DSS to expand.
· Select the Map Feature.
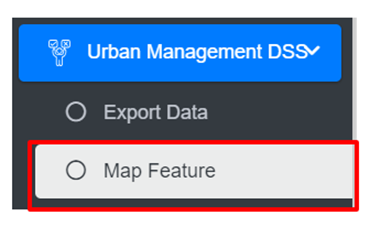
· This redirects to the main section of Map Interface (refer to Figure 18-2).
- The map has four main sections: General Tools, Map, Layers Tab, and Tools Tab.
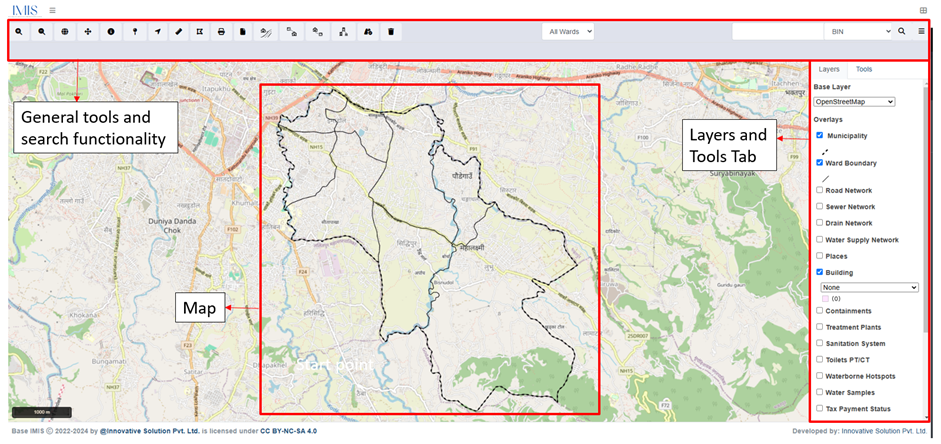
Figure 18- 2 Map
18.3.1 General Tools
General tools and search functionality are on the header (in the page upper part). These tools are mainly for navigating around the map and performing basic operations e.g., measuring, printing, searching based on House Number, BIN, Places and Roads.
Table 18- 1 General Tools Available on IMIS Web Map
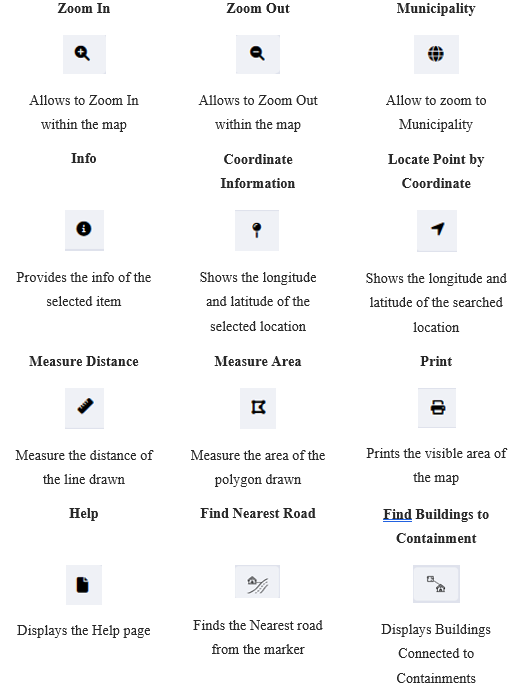
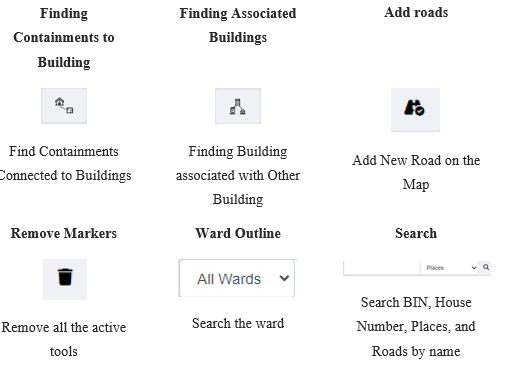
a) Info
· Zoom to an area of interest using navigation tools such as Zoom In, Zoom Out & Navigate (Pan).
· Click on Info to activate it.
· A pop-up containing a list of layers is displayed.
· Select the desired layer and then click at the desired point location of interest.
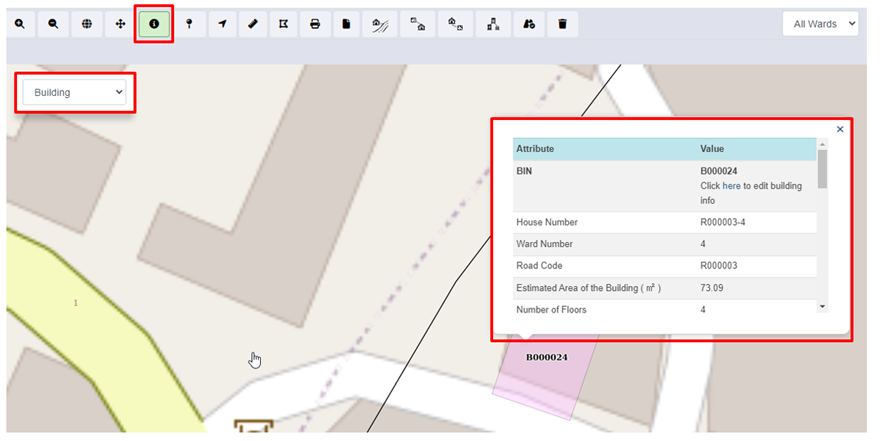
Figure 18- 3 Map Info
Overview:
· Users can see the Attributes and Corresponding Values of the desired layer.
- This tool displays detailed attribute information of the selected layer at the point clicked on the Map. If there are no data layers at a clicked point, no information will be returned. Information will be displayed at the bottom of the map.
b) Coordinate Information
· Zoom to an area of interest using navigation tools such as Zoom In, Zoom Out, and Navigate (Pan).
· Click on the ‘Coordinate Information’ tool to activate it.
· Click on the ‘Coordinate Information’ tool to deactivate it.
· Click on a location on the map to get coordinate information of that clicked point.
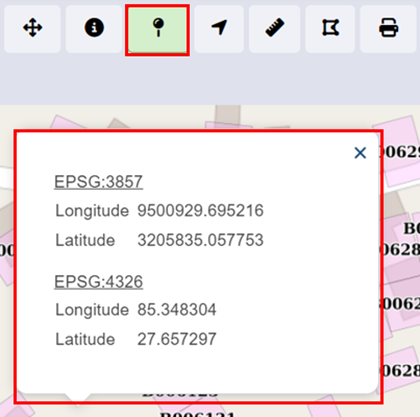
Figure 18- 4 Coordinate Information
Overview:
- This tool will provide coordinate information of a clicked point on a map. Coordinates information is provided in two coordinate systems (EPSG: 3857 & EPSG: 4326).
c) Locate Point by Coordinate
· Activate the tool by selecting it.
· Fill in the necessary longitude and latitude information on a point of interest.
· Click on the Search button and the point is located on the map.

Figure 18- 5 Locate Coordinates by Point
d) Measure Distance
· Zoom to an area of interest using navigation tools such as Zoom In, Zoom Out, and Navigate (Pan).
· Click on the ‘Measure Distance’ tool to activate it.
· Click on a location on the map (Start Point of a line) and drag the line appearing on the map to another location (End Point line). Distance information is provided in meters. Double Click to finish.
· Click on ‘Measure Distance’ again to exit the tool.
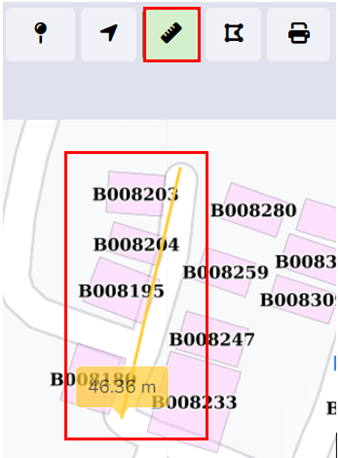
Figure 18- 6 Locate Coordinates by Point
Overview:
· This tool is useful if the user wants to measure distances on the map. E.g., the user may want to measure how far a building is from a road.
e) Measure Area
· Zoom to an area of interest with navigation tools such as Zoom In, Zoom Out, and Navigate (Pan).
· Click on the Measure Area tool to activate it.
· Click on a series of locations on the map that represent the boundary of an area. Area information is provided in square meters. Double Click to finish.
· Click on Measure Area again to exit the tool.
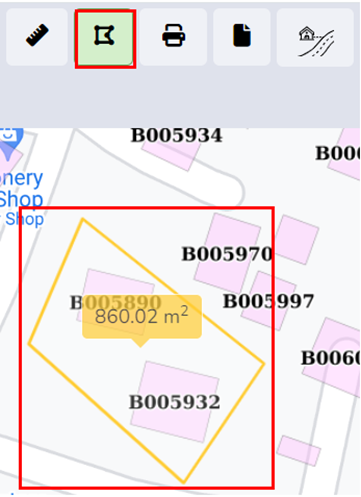
Figure 18- 7 Maps-Measure Area of Polygon
Overview:
- This tool is useful if the user wants to measure an area in the map.
f) Print
· Arrange a view on the map as desired and turn on/off data layers as desired.
· Activate the Print tool by clicking it.
· A pop-up will appear where the user needs to enter Title and Comments if any on the displayed output.
· The scale chosen determines the size of the bounding box which will encompass the map’s print boundary. The bounding box can be dragged as required.
· The paper size, DPI, and orientation can also be set as desired, then Click Print.
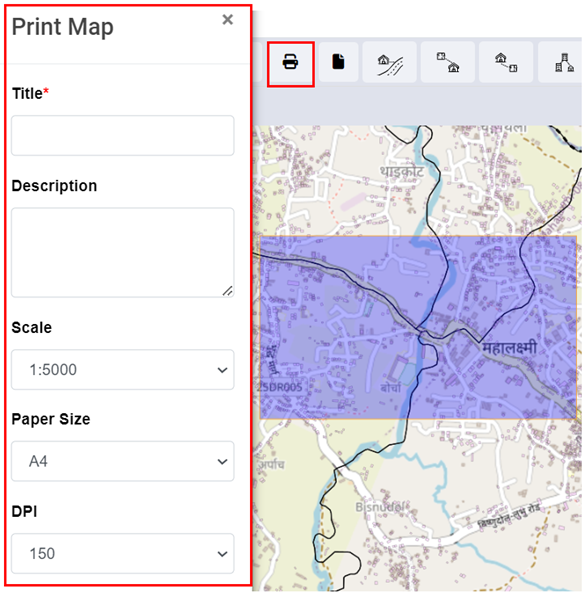
Figure 18- 8 Map Print
g) Find Nearest Road
· Toggle on building, road, and containment layers with an underlying base layer.
· Activate the Find Nearest Road tool.
· Click any point on the map. The nearest Road will be shown with a Marker. Use the Info tool to get information about the Nearest Road, if needed. Use the Measure Distance tool to get distance information between clicked location and the nearest road, if needed.
· Click the Remove Markers tool to get rid of markers from the map.
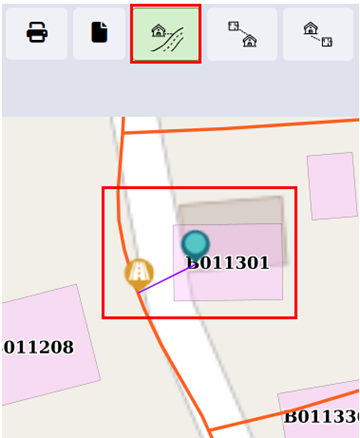
Figure 18- 9 Maps- Nearest Road
Overview
- User can find the nearest road from the desired location.
h) Find Buildings Connected to Containment
· Activate the tool.
· Select the containment for which user want to search the building for the building found is outlined.
· Click the ‘Remove Markers’ tool to get rid of markers from the map.
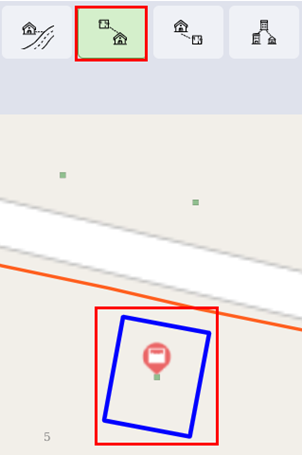
Figure 18- 10 Map- Find Buildings to Containments
Overview:
- User can find the Buildings connected to Containment.
i) Find Containments Connected to Building
· Activate the tool.
· Select the building you want to search for the containment.
· The containment is displayed via markers.
· Click the Remove Markers tool to get rid of markers from the map.
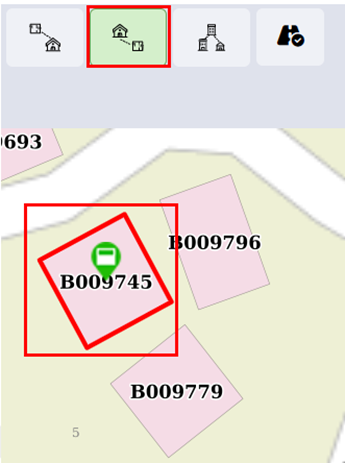
Figure 18- 11 Map- Find Containment to Building
Overview:
· User can find Containments connected to a building.
j) Find Associated Buildings
· Activate the tool.
· Select the main building of which you want to find associated buildings.
· The building is displayed via markers.
· Click the Remove Markers tool to get rid of markers from the map.
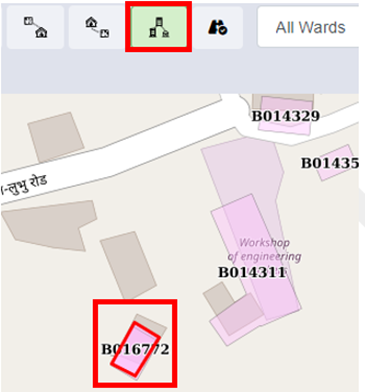
Figure 18- 12 Map- Find Associated Building
Overview:
· Users can find the Associated Building.
· There can be situations where there are multiple small buildings that serve as auxiliary buildings to the main building. It can be a house-help quarter, guard quarters, or such.
- This tool allows the user to identify all associated buildings of the main building.
k) Add roads
· Activate the add road tool.
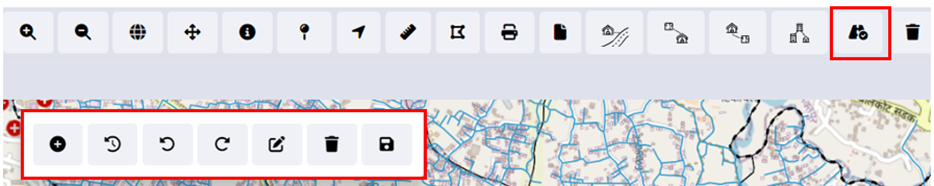
Figure 18- 13 Map- Add Roads
- For reference chapter 14.2.2
l) Remove Markers
· Click on the Remove Markers.
· Markers are removed from the map.

Figure 18- 14 Map- Remove Marker
Overview:
· Users can remove markers from the map tools.
- Some of the tools in Tools TAB (e.g., Find Nearest Road) generate temporary Markers for visualization on the map. This tool is used for removing such Markers.
m) Search
· Choose the desired criteria.
· Type a Code based on which building needs to be located on the map.
· Click the Search button.
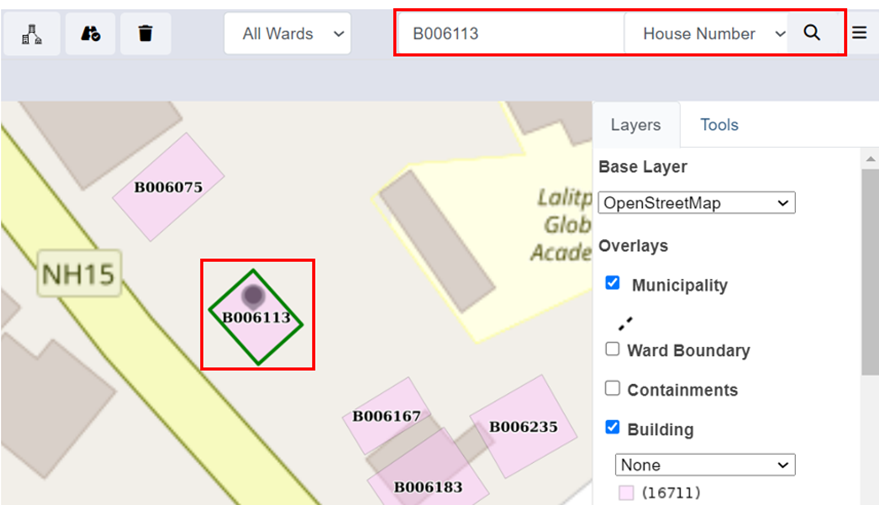
Figure 18- 15 Map- Search using BIN Code
Overview:
· Users can search specific roads, buildings, and places.
· If the user wants to navigate to a specific location (E.g., specific road, specific building based on Holding No.) in the map, search tools are extremely beneficial.
- The search tool provides a criterion to search for a specific building based on criteria such as BIN, Holding No, Tax Code, Landmarks, or Road code.
18.3.2 Layers TAB
The Layers TAB in IMIS provides a map-based interface where users can visualize information from various modules and submodules. It also allows users to select their preferred base layer (e.g., Google, Bing, OSM) for viewing the map. In the 'Overlays' section of the Layers tab, users can choose specific layers to display on the map. These layers represent data maintained in the various submodules and modules of IMIS and the styles present in the individual dropdowns are based on the attribute information maintained in their respective sub modules. For example, if a user selects the ‘Buildings’ layer, the attributes of the ‘Buildings’ sub module will be listed in the dropdown, and the user can select the attribute they want to visualize in the map. User can also select Summarized Grids layer (0.5 km grid) to view the spatial status of the Municipality based on specific criteria, e.g., No. of Buildings, Wards, etc.
Note: The list of data layers available to a user is government by their login credentials.
· Click the nearby checkbox to toggle ON/OFF a specific data layer.

Figure 18- 16 Visualization of different Layers based on two different criteria
Overview:
· If a data layer has multiple visualization options, a drop-down list will appear.
- Change the options in the list to change visualization based on different attributes of the data layer.
18.3.3 Tools TAB
Tools TAB enlists different specialized tools developed specifically to cater to the needs of various users of IMIS. There are altogether 20 different tools categorized under different headings such as Service Delivery Tools, General Tools, Data Export Tools, Decision Tools, and Summary Information. The availability of tools will be governed by the login credentials of the user.
Table 18- 2 Tools
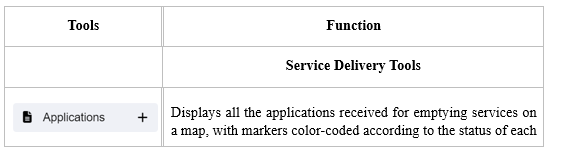
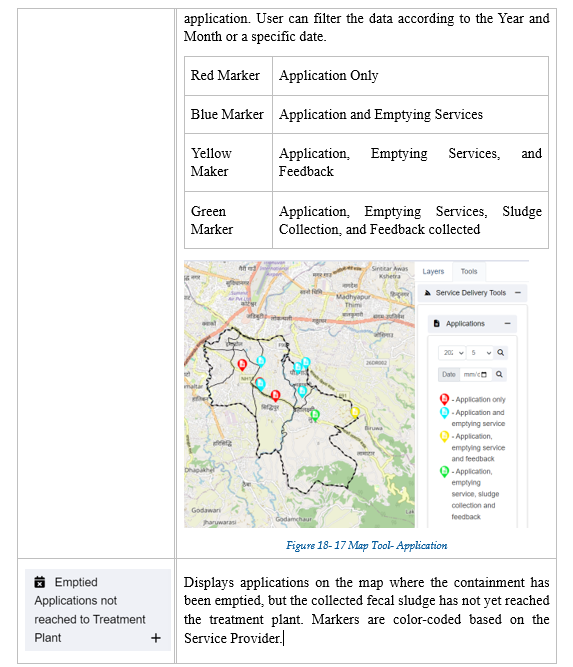
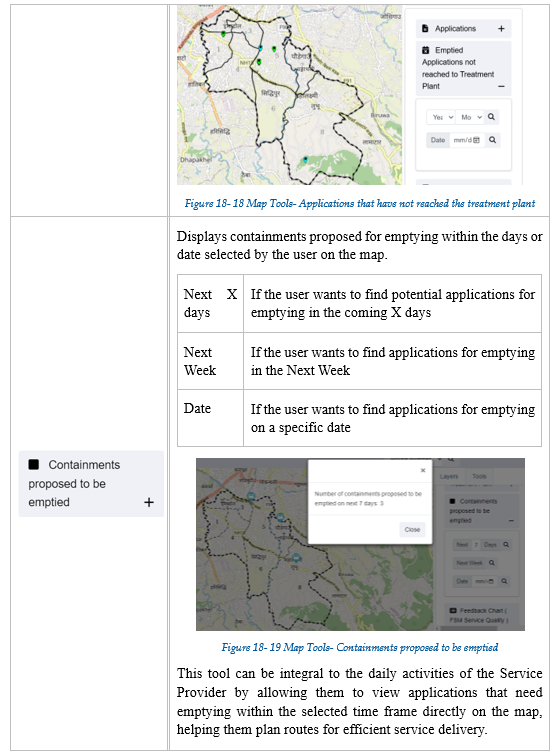
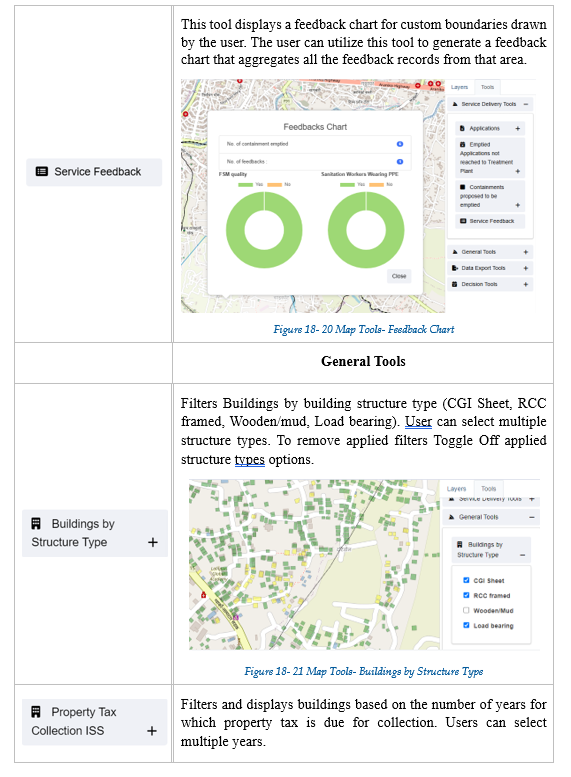
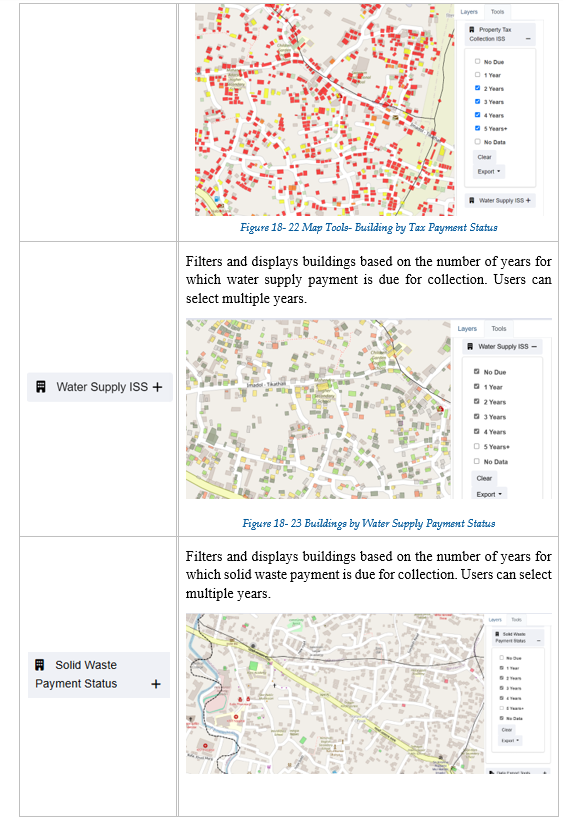
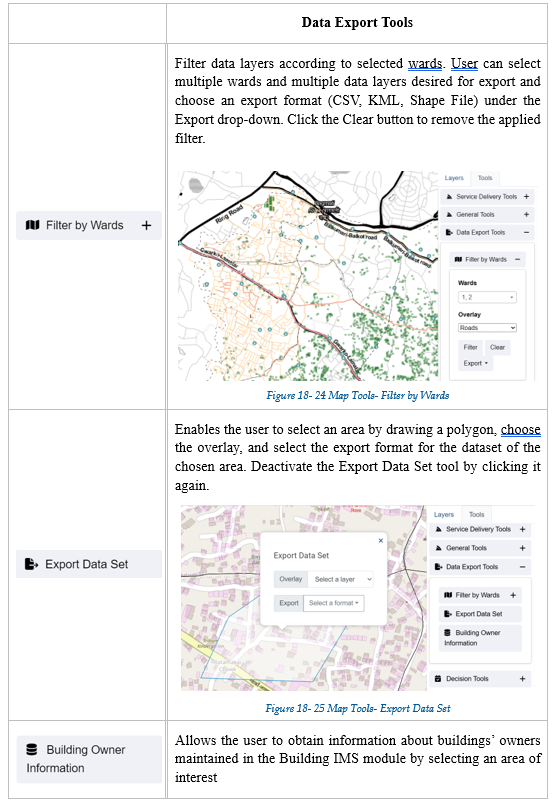
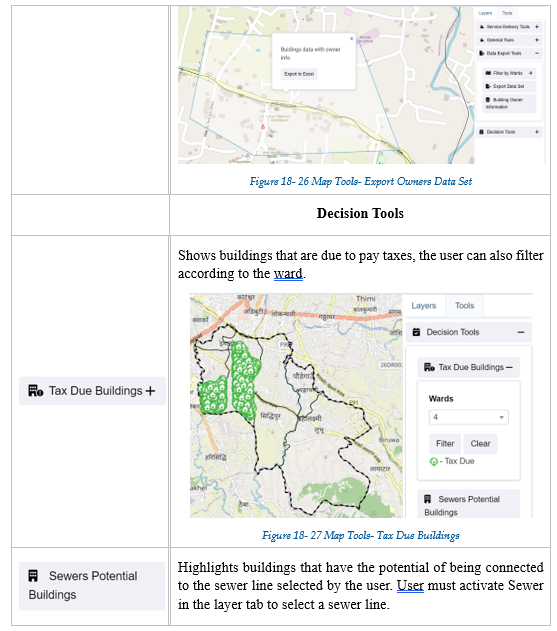
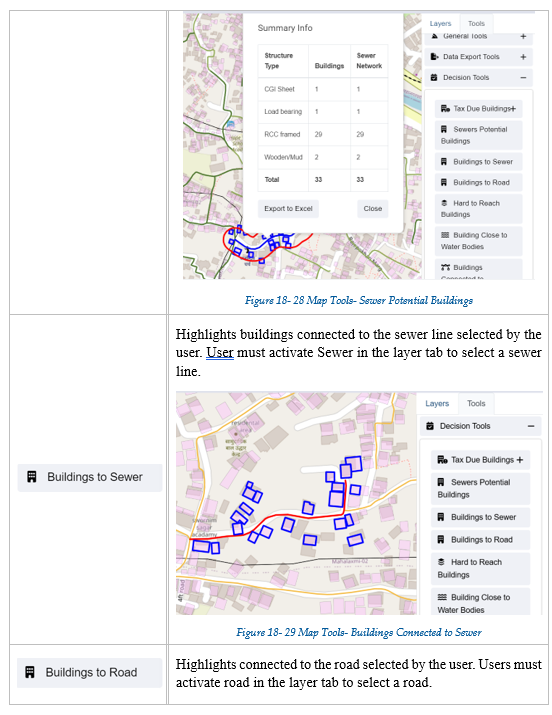
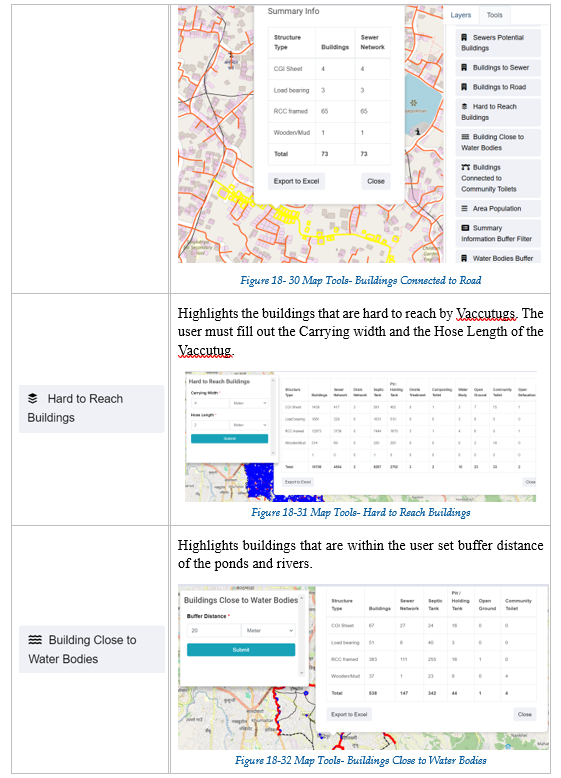
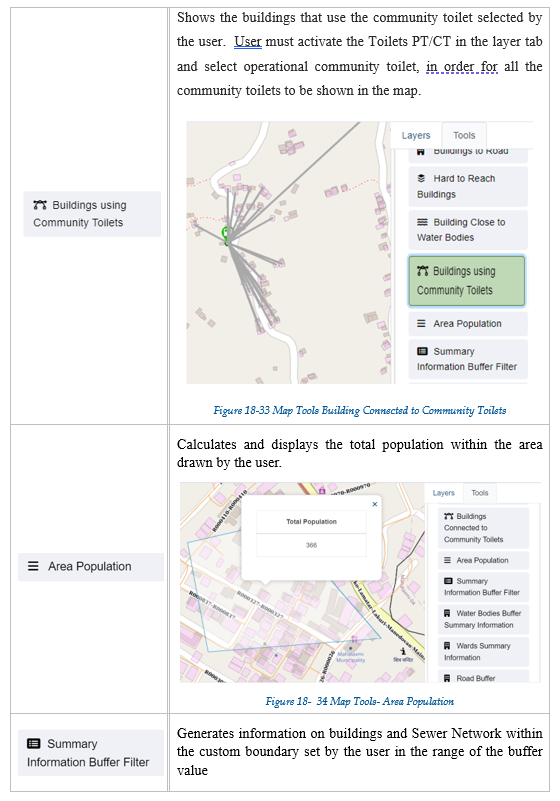
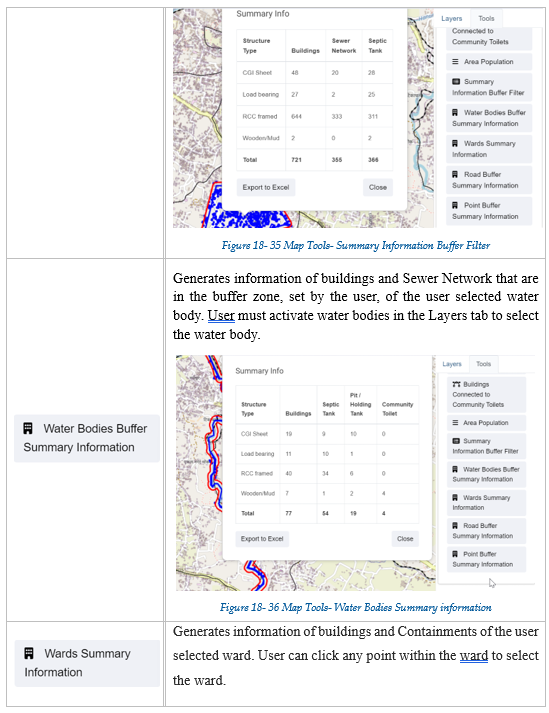
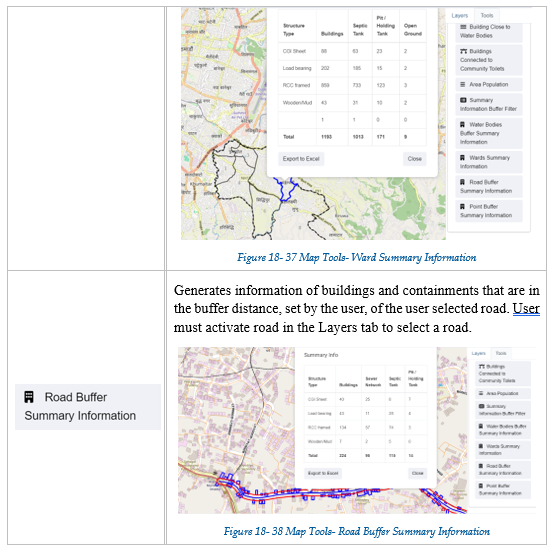
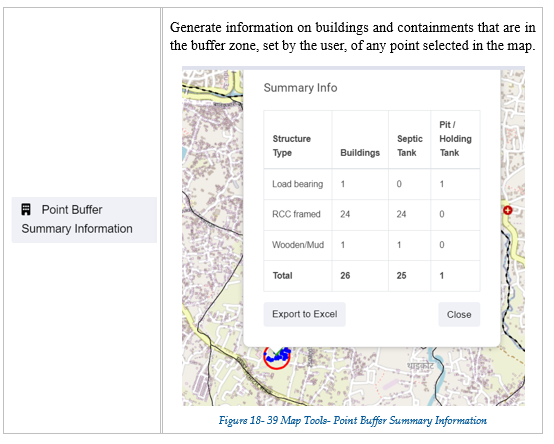
Public Health ISS
PHISS is a core IMIS module designed to help municipalities monitor and address public health and sanitation challenges. It facilitates the collection and maintenance of water sample data from groundwater, surface water, and treated wastewater, ensuring compliance with water contamination standards and supporting CWIS environmental monitoring objectives.
PHISS also tracks waterborne disease cases (e.g., diarrhea, cholera, dysentery, typhoid) and identifies hotspot areas, including associated fatalities, enabling municipalities to conduct spatial analysis and implement targeted interventions.
The module supports CWIS indicators by monitoring:
- Water contamination compliance across different water sources.
- Incidence of faecal-oral diseases to assess sanitation system effectiveness.
PHISS provides data export tools for CSV, Shape, and KML formats, allowing municipalities to utilize the data for strategic planning and resource allocation to reduce public health risks.
Introduction to Public Health ISS
PHISS is another core module of the IMIS, designed to empower municipalities in monitoring and addressing public health and sanitation challenges. PHISS enables the collection and maintenance of water sample data from various sources, including groundwater, surface water, and treated wastewater, to ensure compliance with water contamination standards. This functionality directly aligns with the CWIS objective of monitoring environmental outcomes associated with sanitation systems. Additionally, PHISS records and tracks cases of waterborne diseases across the city, providing municipalities with crucial data to understand and mitigate public health risks.
One of the standout features of PHISS is its ability to maintain spatial and attribute data related to hotspot areas where waterborne diseases, such as diarrhea, cholera, dysentery, and typhoid, have been detected. The system also tracks fatalities linked to these diseases, offering a comprehensive overview of the impact on affected households and populations. By integrating this information with the UDSS municipal authorities can conduct detailed analyses of disease prevalence and its underlying causes. This data-driven approach enables strategic planning, targeted interventions, and efficient allocation of resources to reduce health risks in vulnerable areas.
Water sample data and waterborne cases data maintained by PHISS helps municipality to monitor the CWIS indicators (i) Water contamination compliance of the water sources such as groundwater, surface water and treated wastewater, and (ii) Incidence of fecal-oral pathway diseases (e.g. diarrhea, cholera, dysentery and typhoid). With this information, municipalities can assess the effectiveness of sanitation systems in protecting public health and identify areas requiring urgent attention. By addressing these indicators, PHISS supports municipalities in achieving CWIS objectives, ensuring safe water quality and reducing the prevalence of sanitation-related diseases. The data export tools under PHISS allow users to export data in CSV, Shape and KML format where applicable.
19.1 Water Samples
Water Samples sub-module maintains the information regarding the water quality testing with a focus on coliform bacteria levels as an initial indicator of potential water contamination. This module records the spatial location where the samples were taken.
· Open the sidebar and click on Public health ISS to expand.
· Select the Water Samples.
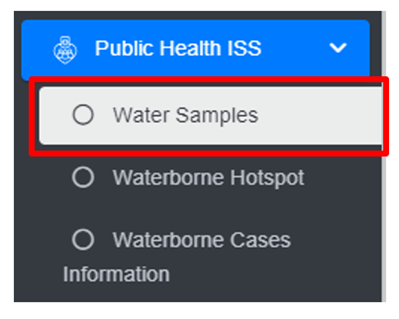
• This redirects to the Water Samples page.
Overview:
The Water Samples page lists all the attribute records stored in the module and provides different Filters, Actions and Tools that can be used according to the requirements. For more details (refer to section 5 Filters, section 6 Actions and section 8 Tools).
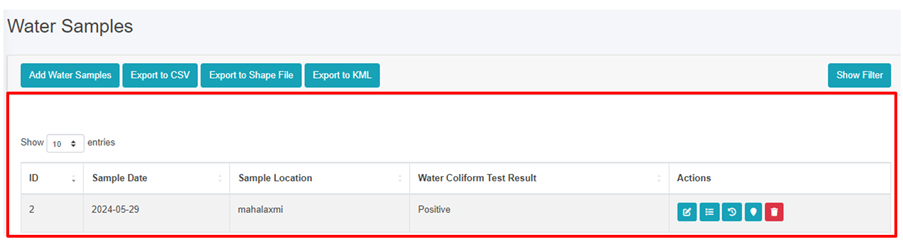
Figure 19-1 List of Water Samples
19.1.2 Add Water Samples
· Click on the ‘Add Water Samples’ button.
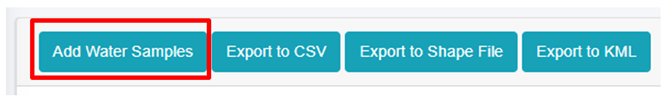
· This redirects to Add Water Samples form page.

Figure 19-2 Add Water Samples
· After filling out the form click Save, and make sure a pop-up message is displayed, refer to section 7.1 Save for more details.
- If a mandatory field is left out or any form failed validation during the form submission a validation message box will be prompted, refer to section 7.2 Validation Message Box for more details.
Overview:
The add water samples page consists of information that is explained below:
· Sample Date – The sample collected date.
· Sample Location – The name of the location from which the sample was collected.
· Water Coliform Test Result - Select the water coliform test result as: positive or negative.
· Click to set Latitude and Longitude - Find the water sample location on the map and pin a marker on the map by clicking on that location. This will mark the spatial location of the water sample in the map with latitude and longitude.
o The top left corner displays the zoom-in and out button
o The top right corner tab displays the Layers and Base maps
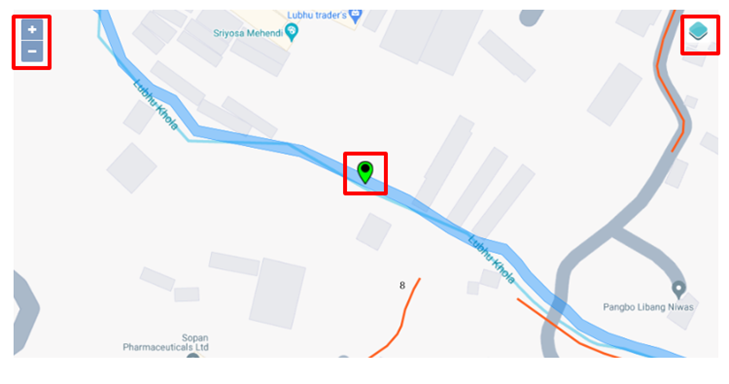
19.2 Waterborne Hotspot
The Waterborne Hotspot is responsible for maintaining data relevant to hotspot identification in a city. Its primary objective is to retain knowledge of diseases spread through contaminated water.
· Open the sidebar and click on Public Health ISS.
· Select the Waterborne Hotspot.
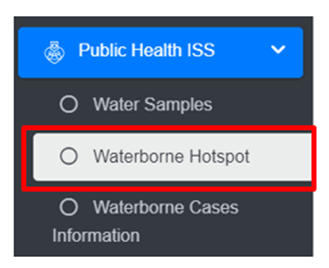
· This redirects to the Waterborne Hotspot page.
Overview:
The Waterborne Hotspot page lists all the attribute records stored in the module and provides different Filters, Actions and Tools that can be used according to the requirements. For more details (refer to section 5 Filters, section 6 Actions and section 8 Tools).
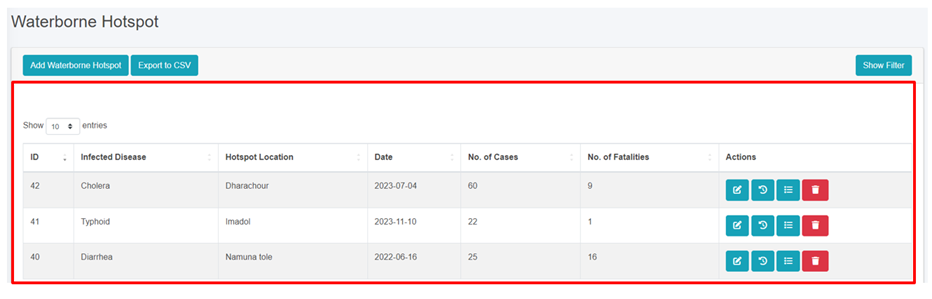
Figure 19- 3 Waterborne Hotspot Page
19.2.2 Add New Waterborne Hotspot
· Click on the Add Waterborne Hotspot button.
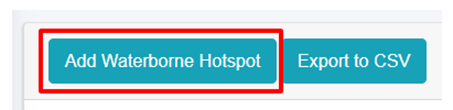
Figure 19- 4 Waterborne Hotspot form
· After filling out the form, click Save and make sure a pop-up message is displayed, refer to section 7.1 Save for more details.
- If a mandatory form field is left out or any form failed validation during the form submission a validation message box will be prompted, refer to section 7.2 Validation Message Box for more details.
Overview
The Add Waterborne Hotspot page consists of different form fields that capture different information which are explained below:
· Hotspot Location: Hotspot location name.
· Date: The date when hotspot locations were identified.
· Infected Disease: Select the name of the disease.
· No of Cases: Number of cases (Male, Female, Other) reported.
· No of Fatalities: Number of fatalities (Male, Female, Other) reported. There is a validation that the number of fatalities must be less than the number of cases.
· Hotspot Area: Choose the location where the hotspots of waterborne diseases are detected, and draw the corresponding area on the map.
o The top left corner displays the zoom-in and out button
o The top right corner tab displays the Layers and Base maps
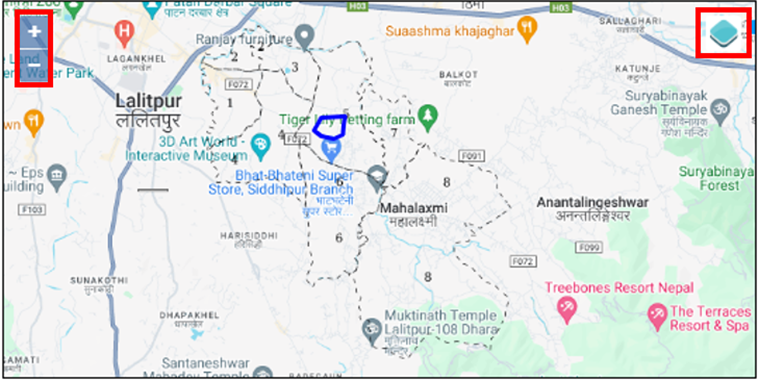
· Notes: Additional notes on information.
- Users can save the form by clicking the save.
19.3 Waterborne Cases Information
The Waterborne Cases Information Sub Module maintains data relevant to Yearly Waterborne cases information. Its primary objective is to retain knowledge of diseases spread through contaminated water.
· Open the sidebar and click on Public Health ISS.
· Select the Waterborne Cases Information.

Overview
The Waterborne Cases Information page lists all the attribute records stored in the module and provides different Filters, Actions and Tools that can be used according to the requirements. For more details (refer to section 5 Filters, section 6 Actions and section 8 Tools).
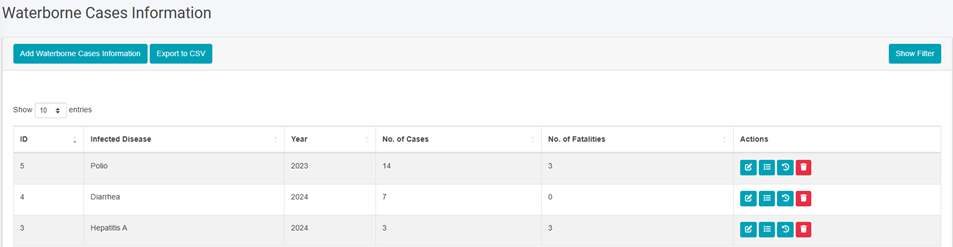
Figure 19- 5 Waterborne Cases Information Page
19.3.2 Add Waterborne Cases Information
· Click on Add Waterborne Cases Information button.
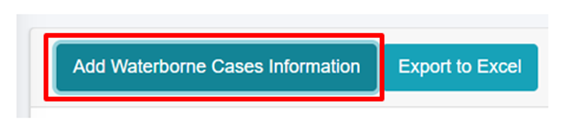
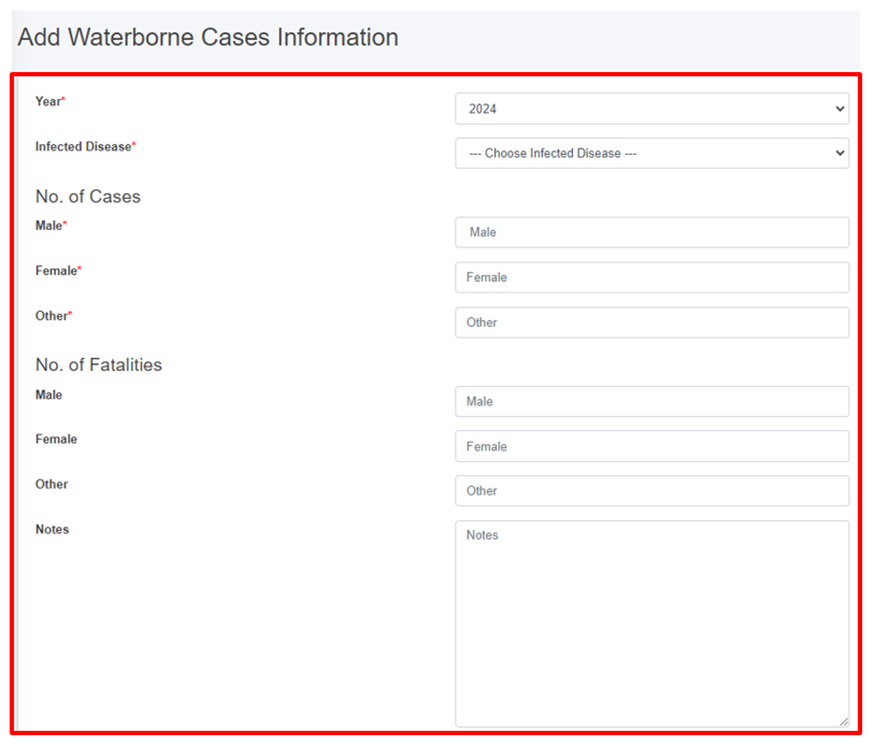
Figure 19- 6 Waterborne Cases Information form
· After filling out the form, click Save and make sure a pop-up message is displayed, refer to section 7.1 Save for more details.
- If a mandatory field is left out or any form failed validation during the form submission a validation message box will be prompted, refer to section 7.2 Validation Message Box for more details.
Overview:
· Year: The year when the diseases’ cases were identified.
· Infected Disease: The name of the infected disease.
· Number of Cases: Number of cases (Male, Female, Other) reported.
· Number of Fatalities: Number of fatalities (Male, Female, Other) reported. There is a validation that the number of fatalities must be less than the number of cases.
· Notes: Additional notes on information.
Settings
This is a module to allows administrators to manage user access and control permissions within the system. Features include:
User Credentials - securely store and manage user authentication details, including usernames, passwords options.
Roles Management- Create and assign roles to users, defining their access level and responsibilities. Roles can be customized to reflect specific job functions.
Permissions Control - fine-tune access by assigning permissions to roles or individuals, ensuring users can only interact with data and features relevant to their role.
20.1 & 20.2 User Information Management
20.1 User Information Management
The User Information Management sub-module that provides information management capabilities related to user information management are grouped in this panel.
20.2 Users
The Users module is responsible for keeping track of system users. According to the user's defined roles, various users have access to the system at varying degrees. The municipality admin is responsible for creating and keeping up with user’s data.
· Open the sidebar and click on the Settings to expand.
· Now, click on the ‘User Information Management’ and select Users.
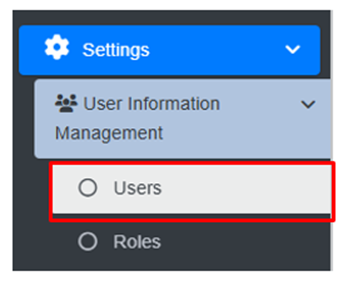
- This redirects to the Users Page.
Overview:
The user can view the lists of existing users in the system.
· User can also create new user (refer to section 20.2.2 Create User).
· Export the data (refer to chapter 8 Tools).
- For more details on the Action buttons (refer to chapter 6 Actions).
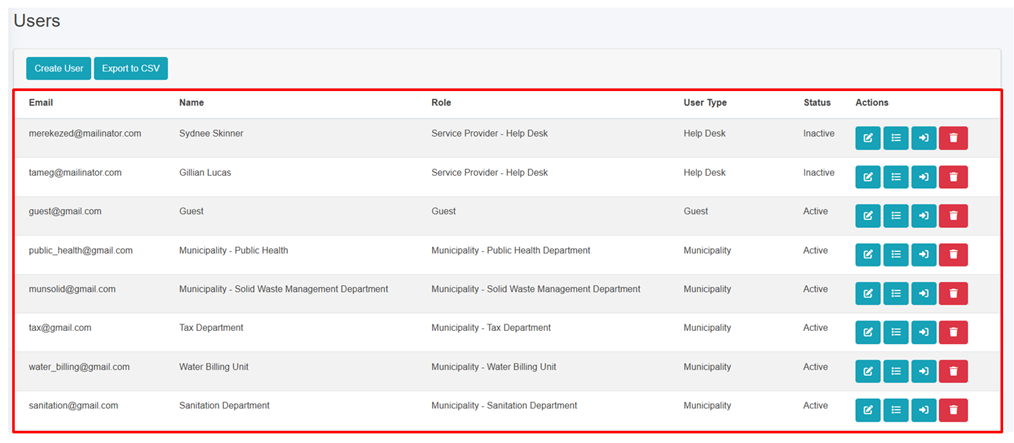
Figure 20- 1 List of Users
20.2.2 Create User
Create user tool which allows users with permission to create a new user.
· Click on “Create User” button.
User will be redirected to the following page:
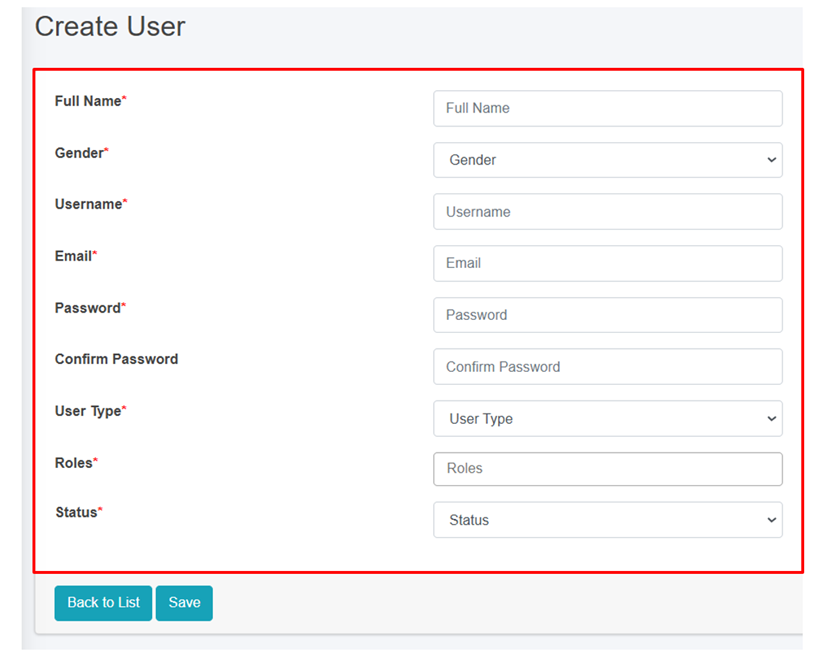
Figure 20- 2 Create new User
· After filling out the form, click Save and make sure a pop-up message is displayed, refer to section 7.1 Save for more details.
- If a mandatory form field is left out or any form failed validation during the form submission a validation message box will be prompted, refer to section 7.2 Validation Message Box for more details.
Users must fill in the required fields which are mentioned below:
· Full Name - Name of the user.
· Gender - Gender of the user.
· Username - Username of the user.
· Email - Email address of the user.
· Password - Encrypted Password of the user.
· Confirm password – Retype the same password again for which user entered for password field.
· User Type - Type of user, such as "Municipality" or "Service Provider"
· Roles - The role from which the user is involved to the specific user type.
- Status – Status of the user in order to access the related roles.
User Form Submission:
The form is dynamically changed according to the User Type that is selected. The role assigned should be carefully selected to ensure the correct role and permissions are being provided to the user.
Overview:
· If a Municipality User is selected, the roles are limited to the Municipality Related Roles.
· If the Treatment Plant User is selected, the roles are limited to Treatment Plant-related roles and the corresponding treatment plant must be chosen as well.
· If the Service Provider User is selected, the roles are limited to Service Provider related roles and the corresponding service provider must be chosen as well.
· If a Help Desk User is selected, the roles are limited to Help Desk-related roles and the corresponding help desk must be chosen as well.
- Choose the appropriate predefined roles and click Save button. The newly created user record will be added at the list.
Note:
· If predefined role is not suitable, the user can add a new role as required via the role page. However, the creator must be careful while creating new role.
· When the user successfully creates a new Role by following the naming convention, the newly created “Role” will be displayed in the Roles Field of Create User form.
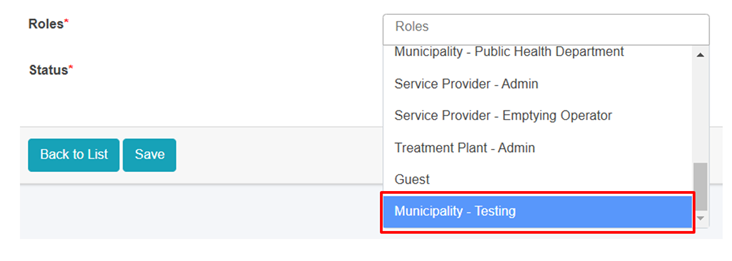
Figure 20- 3 The New Role is displayed in the User Create form
- If the user is associated to any data record, then the deletion is not allowed. If the removal is necessary , it is recommended to change the status to Active/ Operational to Inactive/ Non-operational.
20.3 Roles
The Roles module is responsible for managing user permissions for different modules and sub-modules, as well as defining the level of access for each role. According to the established structure, different responsibilities have access to the system at varying degrees. The administrator can specify the permissions and authority depending on a certain role on this page. For instance, a predefined role designed for service providers has been set up so that any person assigned to that job will have access to the necessary features and tools for managing service delivery effectively. The roles can be sorted by the associated categories.
· Open the sidebar and click on the Settings to expand.
· Now, click on the User Information Management and select Roles.
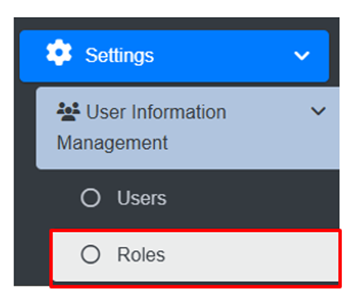
This redirects to the Roles page
Overview:
User can view the list of existing roles in the system.
· User can create a new role (refer to section 20.3.2 Create Role).
· User can Edit the role (refer to section 6.1 Edit Record) and Delete the role (refer to section 6.3 Delete Record).
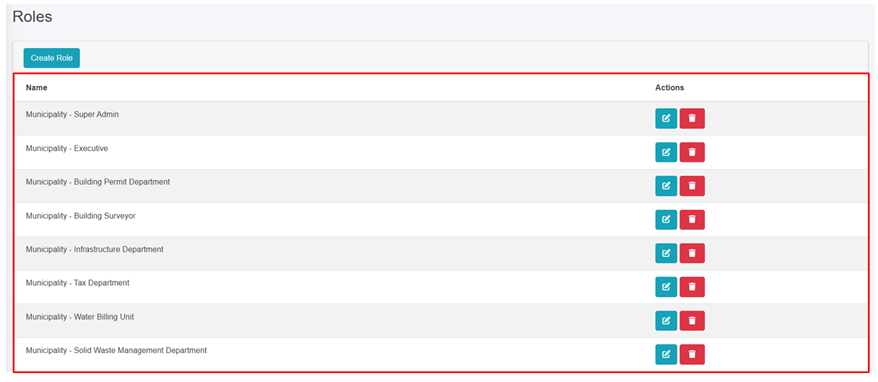
Figure 20- 4 List of Roles
20.3.2 Create Role
Create Role tool is used to add new Role. This tool is to be used when the list of predefined roles does not meet the requirements, or any new role needs to be defined.
· Click on the “Create Role” button.
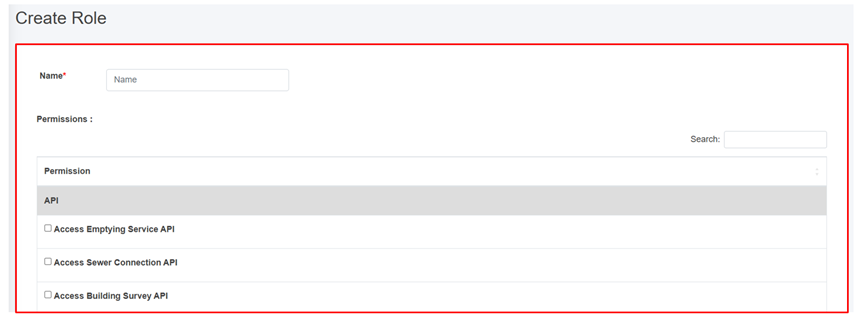
Figure 20- 5 Create new Role
· Provide a suitable name for the new role.
· Then fill the required data, check the boxes of permissions to be provided to that role.
· There is a search field that can be used for efficient and easier navigation through the list of permissions.
· The user should always follow the Zero Trust Policy while assigning permissions to any particular role. The role should have only the permissions that are required by that role. No more, no less.
· Newly added Role will be added at the end of list in Role List.
· The input fields expand when the particular category is selected.
· Fill all the required data and click Save button.
· When the user assigns a role to the designated user, the system notifies the user with the pop-up message as:
· If the user attempts to assign a role to a user who already has the role assigned, the system notifies the user with an error message as:
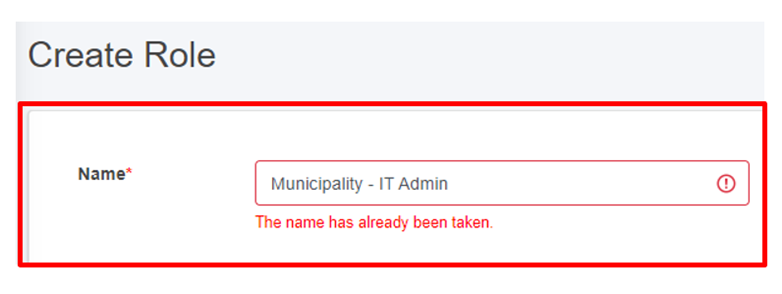
Figure 20- 6 Name validation for role creation
Note:
· To create a new role, the user must follow the naming convention: User Type – Role Name.
-
-
- For example, creating a role as a municipality admin should follow this format: Municipality – IT Admin.
-