14.1 Utility IMS
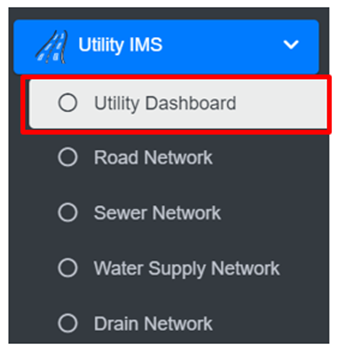
· Open the sidebar and click on ‘Utility IMS’ to expand.
· Select the Utility Dashboard.
· The Utility Dashboard provides a synopsis of the information maintained in this module.
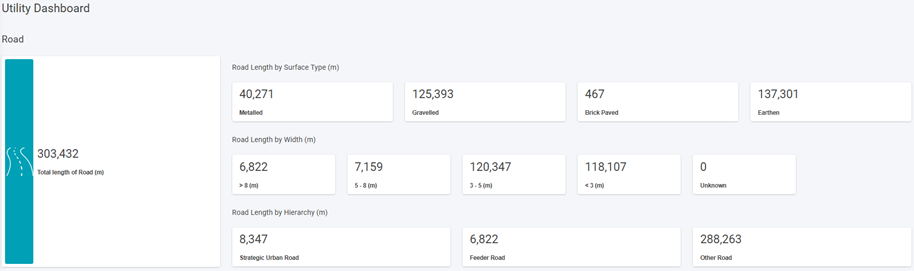
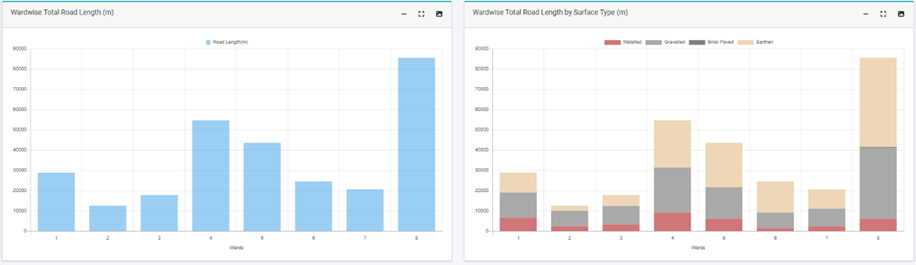
Figure 14- 1 Utility Dashboard
The dashboard typically displays a visual representation of data using graphs, pie charts, etc.
In the Utility Dashboard, bar charts are used to visually present various utility-related information.
· Road Network: length, surface types, hierarchy, and length by width
· Sewer Network: length and length by diameter
· Drain Network: length types, length by type, length by diameter.
- Water Supply Network: length and length by diameter