Stepwise Process Flow Details
Step-by-step instructions in paragraph form for identifying natural drainage network and catchment areas from DEM using QGIS Hydrology tools:
-
Step 1: Load the DEM for the Study Area o Open QGIS and add the DEM layer to your project by navigating to
'Layer' > 'Add Layer' > 'Add Raster Layer'. Browse and select your DEM file.
-
Step 2: Clip the DEM o To clip the DEM to a region larger than the study area, go to 'Raster' > 'Extraction' > 'Clip Raster by Extent'. o Select your input DEM layer and define the extent to cover an area larger than your study region.
- Set the output file and click 'Run'.
-
Step 3: Fill and Interpolate Gaps in the DEM and generate Flow Direction Raster o Install the 'SAGA' processing provider if you haven't already. Go to 'Processing' > 'Toolbox'. o In the processing toolbox, search for 'Fill Sinks (Wang & Liu)' and run the tool. o Select the clipped DEM as the input, set the 'Output corrected DEM' file, and run the tool.
- This will generate both Filled DEM and Flow direction raster files
-
Step 5: Generate the Stream Network o In the processing toolbox, search for 'Flow Accumulation' and run the tool. o Choose the flow direction grid (generated in the previous step) as the input and set the 'Flow accumulation grid' as the output.
-
Step 6: Use the Raster Calculator Tool o In the processing toolbox, search for 'Raster Calculator' and run the tool. o Enter the expression to select pixels greater than a certain threshold (e.g., 5% of the maximum flow accumulation value). o Example: "flow_accumulation@1 > 0.05 * max_flow_accumulation_value" (Replace
'max_flow_accumulation_value' with the actual maximum value). o Set the output raster file and run the tool.
-
Step 7: Define the Stream Order o In the processing toolbox, search for 'Strahler Stream Order' and run the tool. o Choose the flow direction grid and the stream network raster (generated in the previous step) as inputs. o Set the output file and run the tool.
-
Step 8: Convert to Polygon o In the processing toolbox, search for 'Raster to Polygon' and run the tool. o Select the stream order raster (generated in the previous step) as the input and set the output file.
-
Step 9: Generate the Drainage Network o The stream polygons obtained from the previous step represent the drainage network classified according to stream order.
-
Step 10: Create a New Shapefile o To delineate catchment areas and outfall locations, you can use a combination of 'Raster Calculator' and 'Raster to Polygon' tools to extract catchment boundaries from the flow accumulation raster. Then, manually digitize outfall points as new vector points in a new shapefile.
With these steps, you will be able to identify the natural drainage network and catchment areas from the DEM data using QGIS.
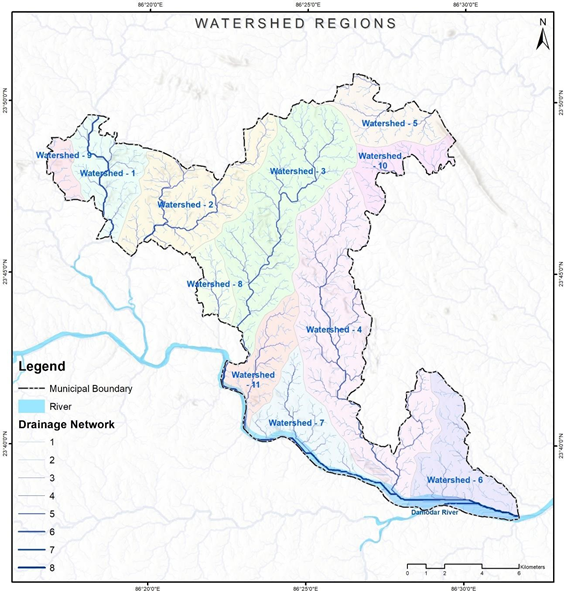

Figure 9 Illustrations of watershed regions at Dhanbad (India)
Source – CWIS spatial analysis, Innpact Solutions and GWSC