Stepwise Process Flow Details
-
Step 1: Gather Building Data
The initial step in the process involves gathering the relevant building data. This includes a building-level land-use map which details the characteristics of each building such as its type (e.g., residential, institutional), the number of floors it has, and other relevant data.
-
Step 2: Import Data into GIS
Import this data into your QGIS document. Make sure the data is correctly georeferenced to ensure accurate analysis.
-
Step 3: Identify Key Buildings
Next, use a selection query to identify key buildings that are likely to generate large volumes of wastewater. This includes high-rise buildings (those with more than three floors), apartment complexes, and institutional buildings such as residential schools, colleges, and hospitals.
-
Step 4: Categorize Buildings
Having identified these key buildings, categorize them as 'Bulk Wastewater Generators'. You can create a new field in the building layer's attribute table for this category, and assign each of the identified buildings to this new category.
-
Step 5: Visualize and Analyze
Finally, visualize these buildings on the map for a clear understanding of their distribution across the city. This could involve using different colors or symbols to represent the different categories of buildings. Analyze the spatial pattern of these buildings for insights into the bulk wastewater generation in the city.
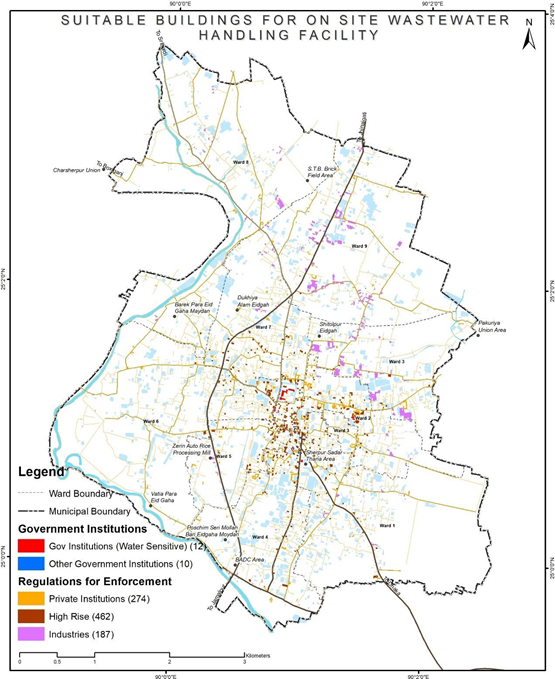

Figure 12 Illustrations of identifying settlements of bulk wastewater volume generator, Sherpur (Bangladesh)
Source – CWIS spatial analysis, Innpact Solutions and GWSC
No Comments