3.1 Assessments of Hard to Reach (HTR) Settlements
3.1.1 Data Requirements
- Road Network with road width or categories
- Building footprint and type of building
3.1.2 Stepwise Process Flow Details
- Step 1: Prepare the Data
o Gather geospatial data on building locations and road networks in compatible formats, such as shapefiles or geodatabases.
- Step 2: Overlay Data
o Open QGIS and add the building and road network layers to your project.
o Ensure that both layers are loaded into the Layers Panel and visible in the map view.
o Categorize the road network layer based on road types using the "Categorized" or "Rule-based" symbology options.
- Step 3: Buffer Analysis (100 feet)
o Go to the Processing Toolbox (Processing > Toolbox) to access geoprocessing tools.
o Under "Vector geometry," find and open the "Fixed distance buffer" tool.
o Select the road network layer as the "Input layer" and set the "Buffer distance" to 100 feet (or any desired distance).
o Specify the output file name and location.
o Click "Run" to create the 100-feet buffer zones around the road networks.
- Step 4: Identify Buildings within the 100-feet Buffer
o Still in the Processing Toolbox, search for and open the "Intersection" tool.
o Select the buildings layer as the "Input layer" and the buffer layer (created in Step 3) as the "Overlay layer."
o Set the output file name and location for the intersected buildings.
o Click "Run" to find the buildings that fall within the 100-feet buffer zones.
- Step 5: Buffer Analysis for Additional Distance (200 feet)
o Repeat the same buffer process as in Step 3, but this time set the buffer distance to 200 feet (or any desired distance).
o Create a new buffer zone around the road networks.
- Step 6: Identify Inaccessible Buildings
o In the Processing Toolbox, run the "Symmetrical difference" tool.
o Select the buildings layer as the "Input layer" and the combined 100-feet and 200-feet buffer layers as the "Overlay layer."
o This operation will identify buildings that are outside both buffer zones, which are the "Inaccessible Buildings."
Now, you should have three categories of buildings: those within 100 feet of roads, those between 100 feet and 200 feet, and those more than 200 feet away (inaccessible buildings). The results will be stored in separate layers based on your specified output file names and locations.
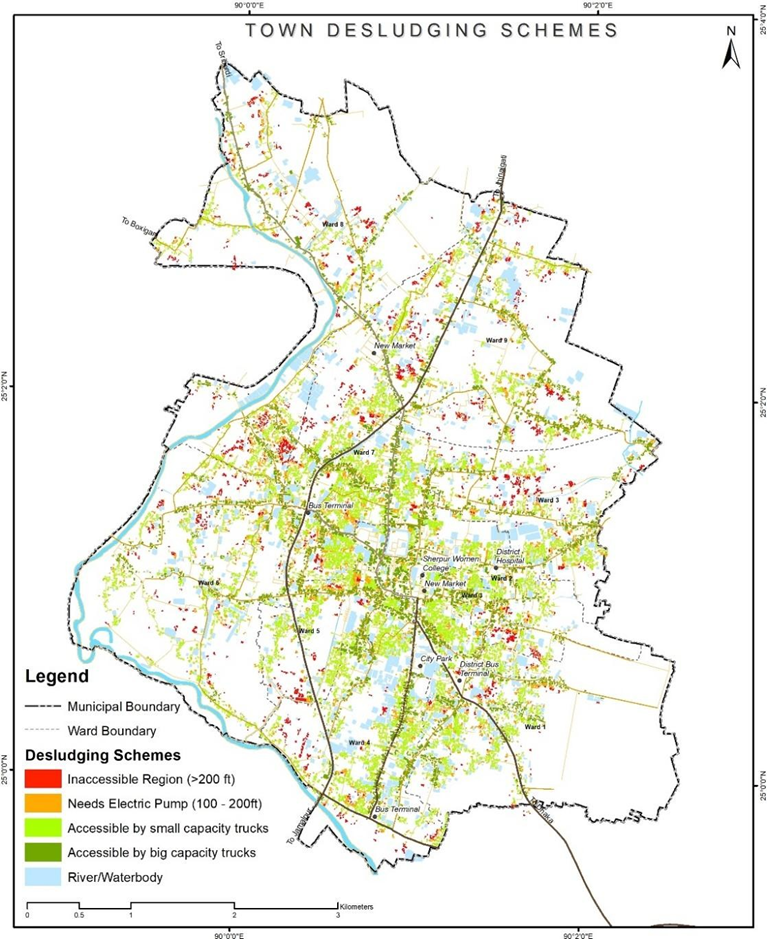
Figure 7 Illustrations of town desludging schemes based on hard-to-reach area findings, Sherpur (Bangladesh)
Source – CWIS spatial analysis, Innpact Solutions and GWSC
3.1.3 Output Application
The output here provides a clear understanding of the settlements accessible by large and small volume trucks. It pinpoints areas requiring additional infrastructure such as pipes and electric pumps and identifies inaccessible areas where manual or electric small carts are necessary for mechanical desludging.
As for its application, such framework can be instrumental in designing a desludging scheme for any towns. It aims to ensure a 100% safe collection mechanism for all users, effectively integrating data, analysis, and visualization to assist in efficient decision- making and strategy formulation for sludge emptying and collections.
No Comments