3.7 Assessment for Containment Improvement Scheme at Town Scale
3.7.1 16.1 Data Requirements
1. Output map of settlement near to water bodies,
2. Output map of settlement with waterlogged and flood prone risk
3. Output map of hard-to-reach settlement area
4. Output map of bulk wastewater generator building
3.7.2 Stepwise Process Flow Details
- Step 1: Gather Spatial Layers of Containment Risk
This initial step involves the collection of spatial layers that map various types of containment risks. These might include data on settlements near water bodies, waterlogged areas, flood-prone regions, hard-to-reach settlements, and locations of bulk wastewater generators.
- Step 2: Overlay Risk Layers on City Building Footprints
Once the necessary spatial layers have been collected, these layers can be overlaid on a city-wide map of building footprints. This process visualizes the proximity of each building to the various containment risks identified in Step 1. GIS software like QGIS is typically used for this process.
- Step 3: Understand City-Wide Risk at Building Level
After the risk layers have been overlaid on the building footprints, it is possible to start understanding the distribution of risks across the city. Different color codes can distinguish between safe zones and risk areas. Within the risk areas, further
categorization by typology can highlight different levels or types of risks. This may include different colors or symbols for buildings that are close to water bodies, located in flood-prone areas, hard to reach, or generate large amounts of wastewater. This city-wide risk understanding will provide a comprehensive view of the containment challenges at the building level.
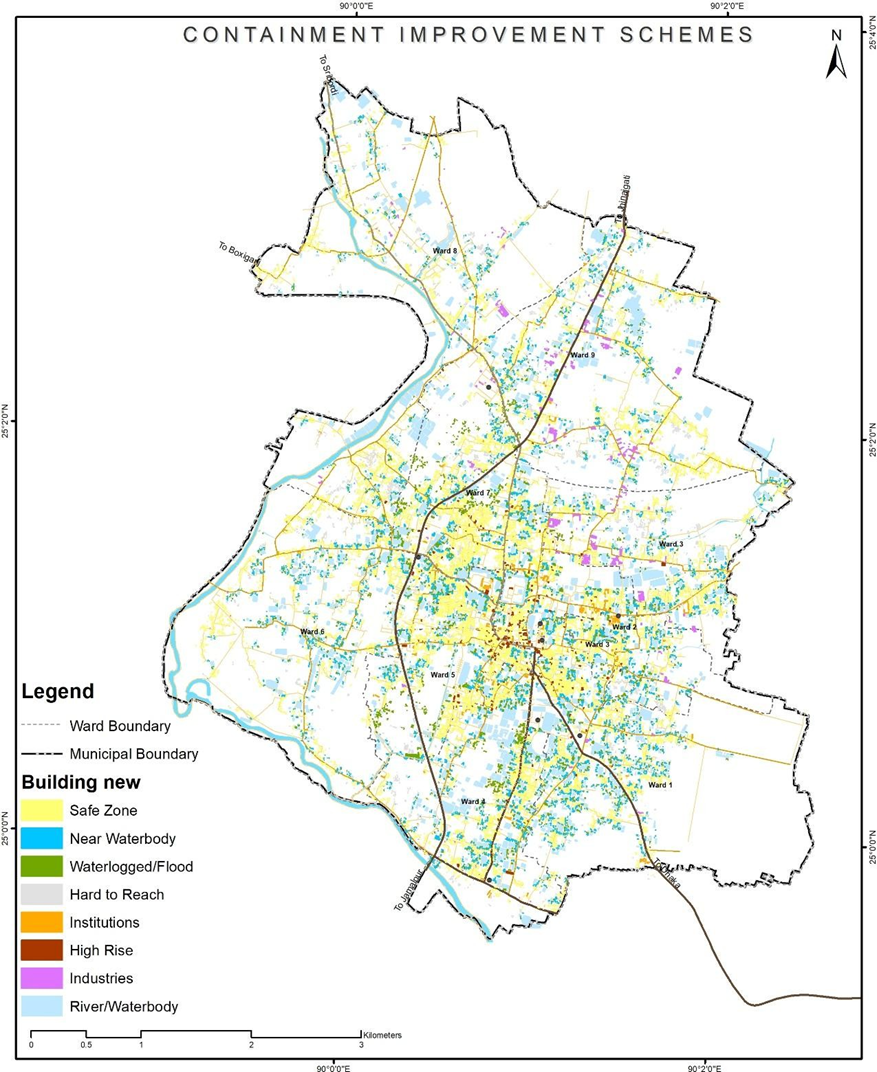
Figure 13 Illustrations of developing containment improvement scheme, Sherpur (Bangladesh)
Source – CWIS spatial analysis, Innpact Solutions and GWSC
3.7.3 Output Application
Location-based information can assist in tracking the evolution of improved containment systems over time. Such data also offers crucial insights for shaping city sanitation regulations, thereby facilitating an understanding of overall containment improvement objectives and designing service-level benchmarks for ongoing monitoring. Moreover, this information can be integrated with building bye-laws to ensure the selection of contextually appropriate containment systems in all future construction projects.
No Comments