3.3 Assessment of Drainage Network with Orders and Density
3.3.1 Data Requirements
1. Elevation data
2. Waterbodies/ Rivers
3.3.2 Stepwise Process Flow Details
Step-by-step instructions in paragraph form for identifying natural drainage network and catchment areas from DEM using QGIS Hydrology tools:
- Step 1: Load the DEM for the Study Area
o Open QGIS and add the DEM layer to your project by navigating to
'Layer' > 'Add Layer' > 'Add Raster Layer'. Browse and select your DEM file.
- Step 2: Clip the DEM
o To clip the DEM to a region larger than the study area, go to 'Raster' > 'Extraction' > 'Clip Raster by Extent'.
o Select your input DEM layer and define the extent to cover an area larger than your study region.
o Set the output file and click 'Run'.
- Step 3: Fill and Interpolate Gaps in the DEM and generate Flow Direction Raster
o Install the 'SAGA' processing provider if you haven't already. Go to 'Processing' > 'Toolbox'.
o In the processing toolbox, search for 'Fill Sinks (Wang & Liu)' and run the tool.
o Select the clipped DEM as the input, set the 'Output corrected DEM' file, and run the tool.
o This will generate both Filled DEM and Flow direction raster files
- Step 5: Generate the Stream Network
o In the processing toolbox, search for 'Flow Accumulation' and run the tool.
o Choose the flow direction grid (generated in the previous step) as the input and set the 'Flow accumulation grid' as the output.
- Step 6: Use the Raster Calculator Tool
o In the processing toolbox, search for 'Raster Calculator' and run the tool.
o Enter the expression to select pixels greater than a certain threshold (e.g., 5% of the maximum flow accumulation value).
o Example: "flow_accumulation@1 > 0.05 * max_flow_accumulation_value" (Replace
'max_flow_accumulation_value' with the actual maximum value).
o Set the output raster file and run the tool.
- Step 7: Define the Stream Order
o In the processing toolbox, search for 'Strahler Stream Order' and run the tool.
o Choose the flow direction grid and the stream network raster (generated in the previous step) as inputs.
o Set the output file and run the tool.
- Step 8: Convert to Polygon
o In the processing toolbox, search for 'Raster to Polygon' and run the tool.
o Select the stream order raster (generated in the previous step) as the input and set the output file.
- Step 9: Generate the Drainage Network
o The stream polygons obtained from the previous step represent the drainage network classified according to stream order.
- Step 10: Create a New Shapefile
o To delineate catchment areas and outfall locations, you can use a
combination of 'Raster Calculator' and 'Raster to Polygon' tools to extract catchment boundaries from the flow accumulation raster. Then, manually digitize outfall points as new vector points in a new shapefile.
With these steps, you will be able to identify the natural drainage network and catchment areas from the DEM data using QGIS.
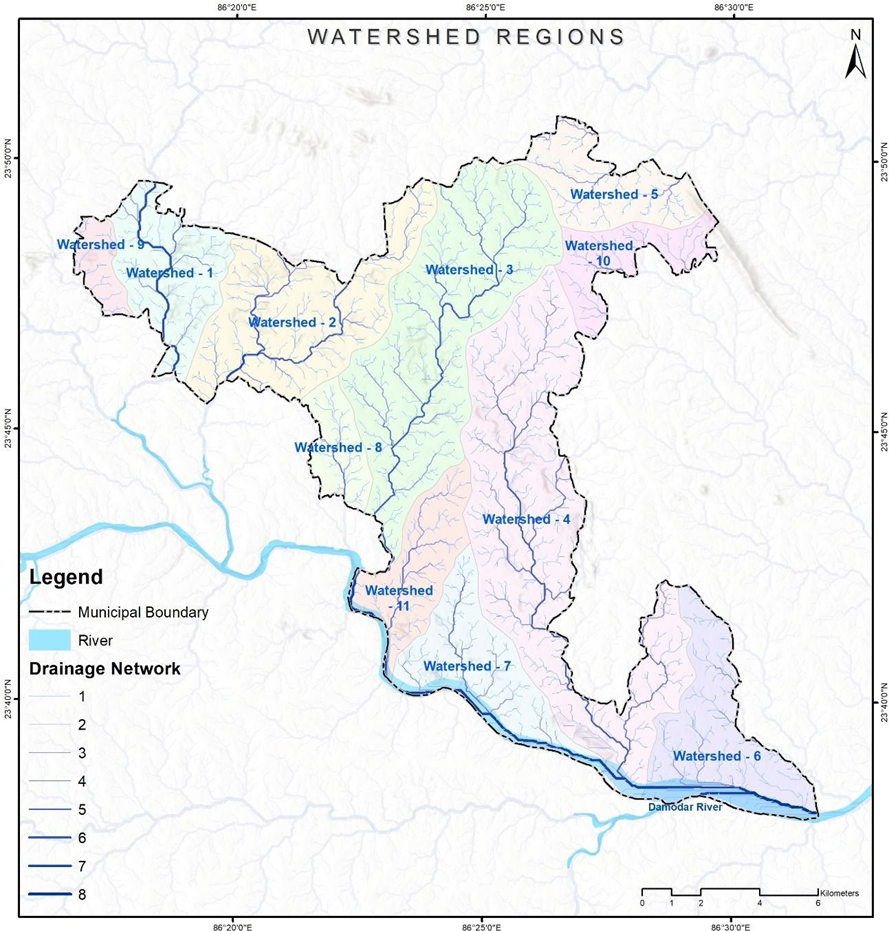
Figure 9 Illustrations of watershed regions at Dhanbad (India)
Source – CWIS spatial analysis, Innpact Solutions and GWSC
3.3.3 Output application
A drainage network map helps delineate the different watersheds within a region, which play a significant role in both sewer and non-sewer zoning for any large town. Furthermore, watershed zones have significant applications in grey water management using an interceptor and diversion (I&D) framework. They can serve as functional linkages with the sewer system or may also operate as independent modules. Further this also has applications in identifying water logged prone area within the city.
No Comments