Dashboard
There are all together six Dashboards considered as the components of UMDSS of the IMIS that serve as its core components: (i) IMIS Dashboard, (ii) Building Dashboard, (iii) FSM Dashboard, (iv) Utility Dashboard, (v) CWIS Dashboard, and (vi) KPI Dashboard. Five of these dashboards have been discussed under their respective functional modules and sub-modules. The remaining dashboard, the IMIS Dashboard, is detailed below.
The IMIS Dashboard serves as the central platform within the IMIS, offering a comprehensive overview of municipal data. It integrates information on building infrastructure, utilities (such as roads, drains, sewer, and water supply), sanitation systems and services, public and community toilets, public health, tax collection, water bill payments, and solid waste management. This dashboard provides municipalities with a unified interface for monitoring and managing citywide operations effectively, supporting informed decision-making and efficient service delivery.
The Urban Management Decision Support System (UMDSS) enables municipalities to implement Citywide Inclusive Sanitation (CWIS) principles, supporting the planning, monitoring, and management of sanitation systems and services through a CWIS-focused approach. It also enhances revenue collection processes, including tax collection, water bill payments, and fees for solid waste management services, while providing actionable spatial insights to improve overall urban management. With its powerful analytical tools, UMDSS empowers municipalities to achieve greater efficiency, transparency, and inclusivity, not only in sanitation management but also in broader urban governance and service delivery,
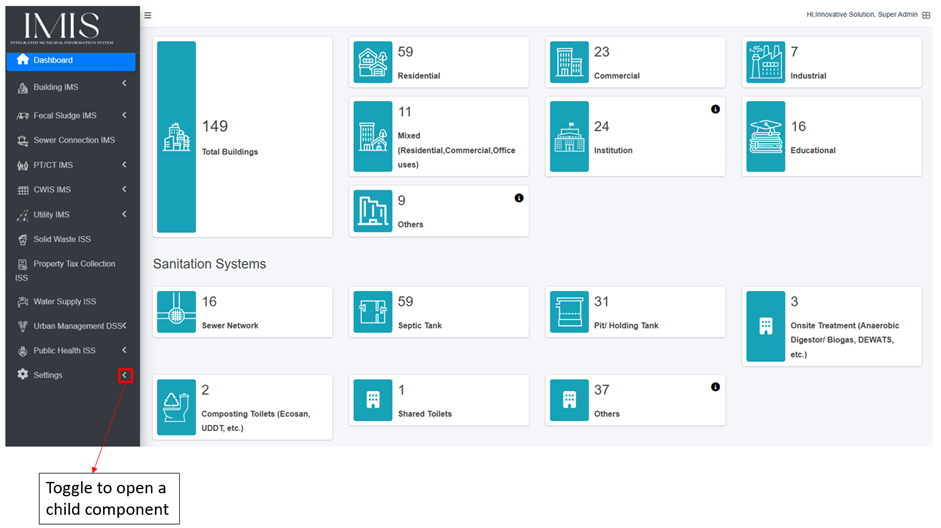
Figure 3- 1 IMIS Dashboard
No Comments